Crude Oil Analysis: Key Psychological Levels Amidst High Volatility.
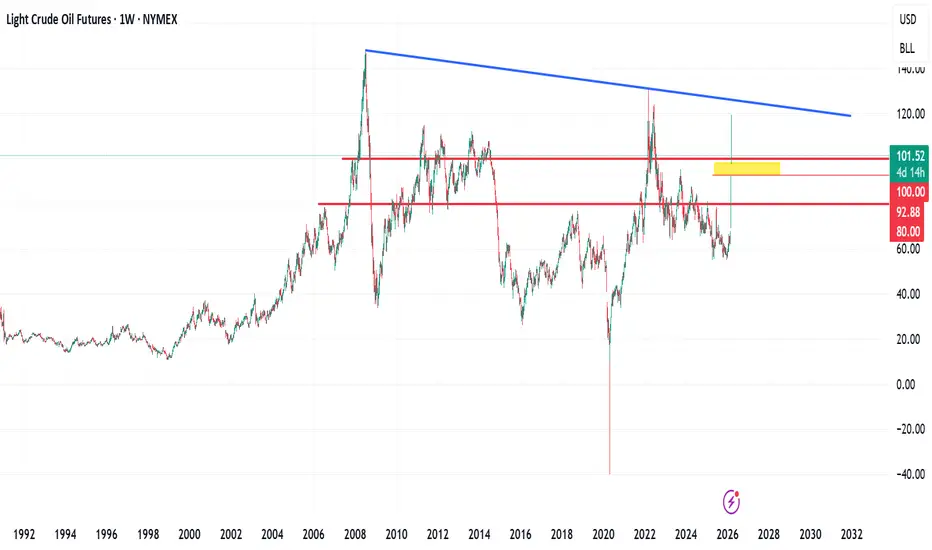
 CL1! prices have reached their highest levels since 2022, marking a significant shift in market structure. This asset had previously maintained a broad descending trend following its June 2022 peak of approximately $130.
Technical Context and Recent Price Action.
The market saw a substantial surge in early March, with prices jumping toward the $120 level. This rapid movement has left a notable price gap on the chart (highlighted in yellow).
From a technical perspective, such gaps often act as magnets for future price action, though they do not always fill immediately during periods of high momentum.
Support Zones and Market Psychology.
Considering the current price structure and market psychology, several key levels are now in focus:
1. A break above with a descending TL acting as a resistance zone above
$120 Level: This remains the primary psychological resistance. As a "round number," it often serves as a pivot point for institutional and retail sentiment.
2. A break below the current zone/ $100 psychological price is likely to send this asset further down the hill
3. $90 Zone: Should the $100 level fail to hold, the market may move to fill the previously mentioned gap. This would likely push prices toward the next established support zone near $90.
Fundamental Considerations.
Traders should remain mindful that geopolitical developments are currently the primary drivers of this volatility. Supply-chain updates and shifting international tensions can override technical signals in the short term.
Given the current environment, a cautious approach is recommended. Investors should monitor global news closely, as rapid shifts in fundamentals can lead to sudden price swings.
Disclaimer:
This analysis is for informational purposes only and does not constitute investment advice. It is not intended as a solicitation to buy or sell any financial instrument. Trading involves significant risk, and individuals should consult with a professional financial advisor before making any investment decisions.
CL1! prices have reached their highest levels since 2022, marking a significant shift in market structure. This asset had previously maintained a broad descending trend following its June 2022 peak of approximately $130.Technical Context and Recent Price Action.
The market saw a substantial surge in early March, with prices jumping toward the $120 level. This rapid movement has left a notable price gap on the chart (highlighted in yellow).
From a technical perspective, such gaps often act as magnets for future price action, though they do not always fill immediately during periods of high momentum.
Support Zones and Market Psychology.
Considering the current price structure and market psychology, several key levels are now in focus:
1. A break above with a descending TL acting as a resistance zone above
$120 Level: This remains the primary psychological resistance. As a "round number," it often serves as a pivot point for institutional and retail sentiment.
2. A break below the current zone/ $100 psychological price is likely to send this asset further down the hill
3. $90 Zone: Should the $100 level fail to hold, the market may move to fill the previously mentioned gap. This would likely push prices toward the next established support zone near $90.
Fundamental Considerations.
Traders should remain mindful that geopolitical developments are currently the primary drivers of this volatility. Supply-chain updates and shifting international tensions can override technical signals in the short term.
Given the current environment, a cautious approach is recommended. Investors should monitor global news closely, as rapid shifts in fundamentals can lead to sudden price swings.
Disclaimer:
This analysis is for informational purposes only and does not constitute investment advice. It is not intended as a solicitation to buy or sell any financial instrument. Trading involves significant risk, and individuals should consult with a professional financial advisor before making any investment decisions.

פרסומים קשורים
כתב ויתור
המידע והפרסומים אינם מיועדים להיות, ואינם מהווים, ייעוץ או המלצה פיננסית, השקעתית, מסחרית או מכל סוג אחר המסופקת או מאושרת על ידי TradingView. קרא עוד ב־תנאי השימוש.
פרסומים קשורים
כתב ויתור
המידע והפרסומים אינם מיועדים להיות, ואינם מהווים, ייעוץ או המלצה פיננסית, השקעתית, מסחרית או מכל סוג אחר המסופקת או מאושרת על ידי TradingView. קרא עוד ב־תנאי השימוש.