Weekly Chart :

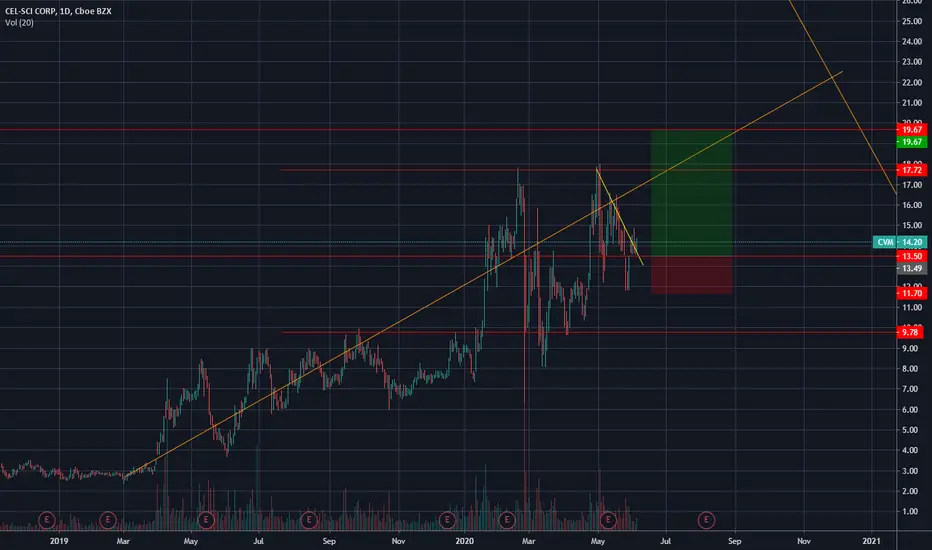
 CVM Finished the Major Down Trend on April 2019, and from then is in a solid Secondary Up Trend.
Note 13.50 Historical level, which serve us as a good support to form a trade.
Daily Chart :

Minor Down Trend about to end (Yellow):

Line Chart :

The Trade Plan :

Wait for a Clear Bullish Minor sign -
1. Strong buying Candle on 13.50 Level .
2. Retest of the Orange Trendline and closing above the Yellow Trendline.
CVM Finished the Major Down Trend on April 2019, and from then is in a solid Secondary Up Trend.Note 13.50 Historical level, which serve us as a good support to form a trade.
Daily Chart :
Minor Down Trend about to end (Yellow):
Line Chart :
The Trade Plan :
Wait for a Clear Bullish Minor sign -
1. Strong buying Candle on 13.50 Level .
2. Retest of the Orange Trendline and closing above the Yellow Trendline.

כתב ויתור
המידע והפרסומים אינם מיועדים להיות, ואינם מהווים, ייעוץ או המלצה פיננסית, השקעתית, מסחרית או מכל סוג אחר המסופקת או מאושרת על ידי TradingView. קרא עוד ב־תנאי השימוש.
כתב ויתור
המידע והפרסומים אינם מיועדים להיות, ואינם מהווים, ייעוץ או המלצה פיננסית, השקעתית, מסחרית או מכל סוג אחר המסופקת או מאושרת על ידי TradingView. קרא עוד ב־תנאי השימוש.