
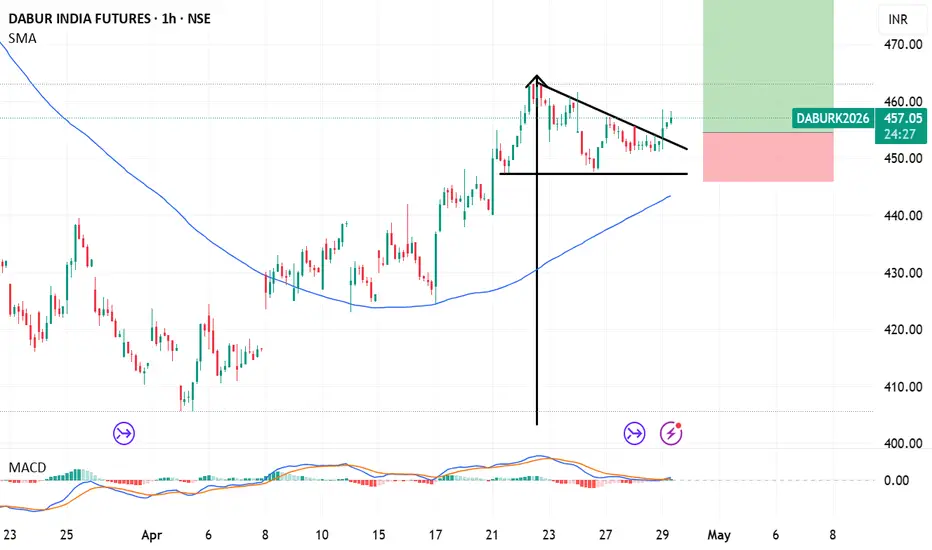
Dabur India Futures (DABUR) has been showing signs of consolidation and potential base-building, with analysts noting technical signals that could indicate a reversal, including a potential flag pattern on lower timeframes.
The stock has been attempting to form a base in the ₹440–₹465 range.
Action: Potential Long/Buy
Target (T1): ₹485 (Based on pattern breakout projection)
Stop Loss (SL): ₹445 (Below immediate support levels)
Key Support to Watch: ₹446–₹449
Key Resistance to Break: ₹461–₹463
The stock has been attempting to form a base in the ₹440–₹465 range.
Action: Potential Long/Buy
Target (T1): ₹485 (Based on pattern breakout projection)
Stop Loss (SL): ₹445 (Below immediate support levels)
Key Support to Watch: ₹446–₹449
Key Resistance to Break: ₹461–₹463
עסקה סגורה: הגיע לסטופ

כתב ויתור
המידע והפרסומים אינם מיועדים להיות, ואינם מהווים, ייעוץ או המלצה פיננסית, השקעתית, מסחרית או מכל סוג אחר המסופקת או מאושרת על ידי TradingView. קרא עוד ב־תנאי השימוש.
כתב ויתור
המידע והפרסומים אינם מיועדים להיות, ואינם מהווים, ייעוץ או המלצה פיננסית, השקעתית, מסחרית או מכל סוג אחר המסופקת או מאושרת על ידי TradingView. קרא עוד ב־תנאי השימוש.