
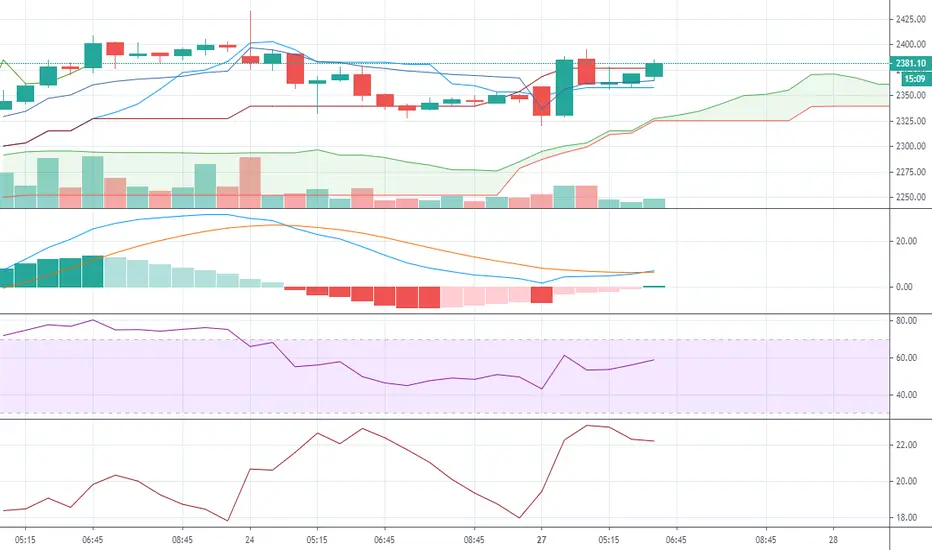
Intraday Cash Buy DIVISLAB @2364.00-2371 SL 2316.7 TGT 2452
It has good momentum with MACD cross over and 15 min chart ha TK cross over as well.
It has good momentum with MACD cross over and 15 min chart ha TK cross over as well.
עסקה פעילה
Those holding add more and those missed create fresh long. Divi’s Lab is one of the top-performing candidates from the pharma sector. In the ratio chart, the price has managed to breakout above the downsloping trendline indicating outperformance of Divi’s Lab in relation to Nifty Pharma Index. In the point & figure chart, the price has taken support at the upward sloping trendline and a fresh breakout buy signal is also triggered, suggesting bullish undertone. Go long in Divi’s Lab in the Rs 2,410-2,430 range with a stop loss at Rs 2,365 for targets of Rs 2,500 and Rs 2,560.עסקה סגורה: היעד הושג
First TGT hit but it looks good for more.
כתב ויתור
המידע והפרסומים אינם מיועדים להיות, ואינם מהווים, ייעוץ או המלצה פיננסית, השקעתית, מסחרית או מכל סוג אחר המסופקת או מאושרת על ידי TradingView. קרא עוד ב־תנאי השימוש.
כתב ויתור
המידע והפרסומים אינם מיועדים להיות, ואינם מהווים, ייעוץ או המלצה פיננסית, השקעתית, מסחרית או מכל סוג אחר המסופקת או מאושרת על ידי TradingView. קרא עוד ב־תנאי השימוש.