
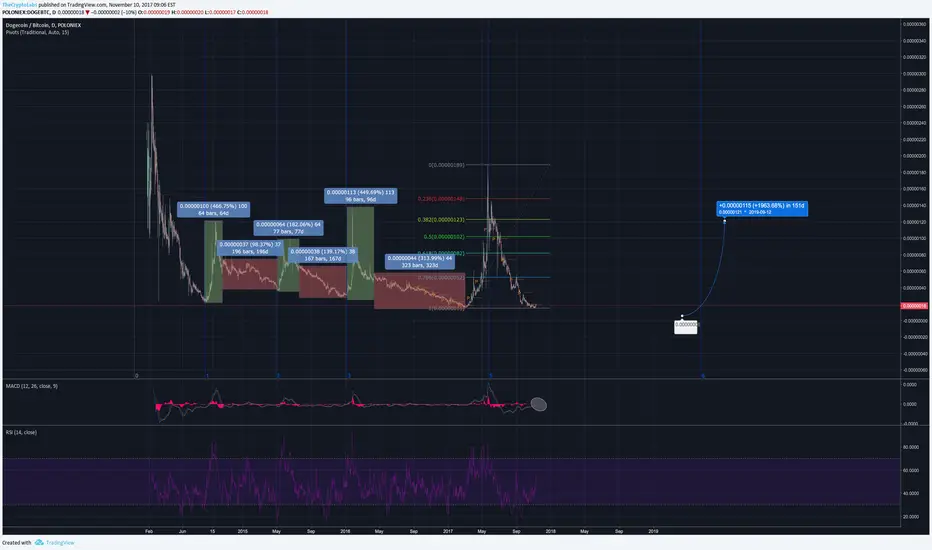
As you can see by the chart, every few months or so, our DOGE decides to wake up, pop, and go back to sleep for 2-3X the length of the "pop".
After every peak, it tends to slowly go down and fall around 15-20% less than where it started.
You can use fib retracement on the higher high and lower low to see.
I used fib timeframe to see if I could spot patterns and seems the lines align with the beginning of cycles, all 4 of them.
It shows the next fib timeframe at January / February 2018.
Stay on the lookout for this trade.
Set alerts & get ready to buy a small bag of dogecoin.
הערה
Thank me at:thecryptolabs.com

כתב ויתור
המידע והפרסומים אינם מיועדים להיות, ואינם מהווים, ייעוץ או המלצה פיננסית, השקעתית, מסחרית או מכל סוג אחר המסופקת או מאושרת על ידי TradingView. קרא עוד ב־תנאי השימוש.
כתב ויתור
המידע והפרסומים אינם מיועדים להיות, ואינם מהווים, ייעוץ או המלצה פיננסית, השקעתית, מסחרית או מכל סוג אחר המסופקת או מאושרת על ידי TradingView. קרא עוד ב־תנאי השימוש.