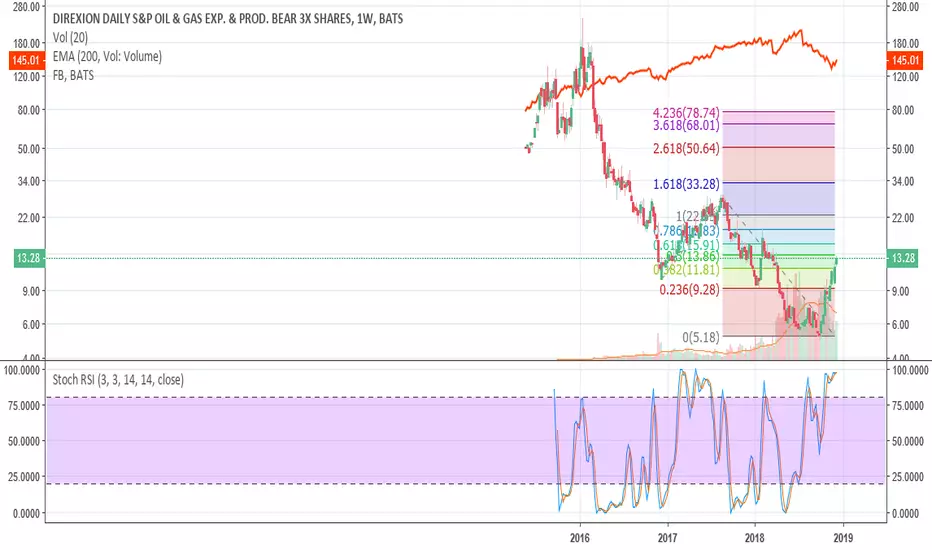
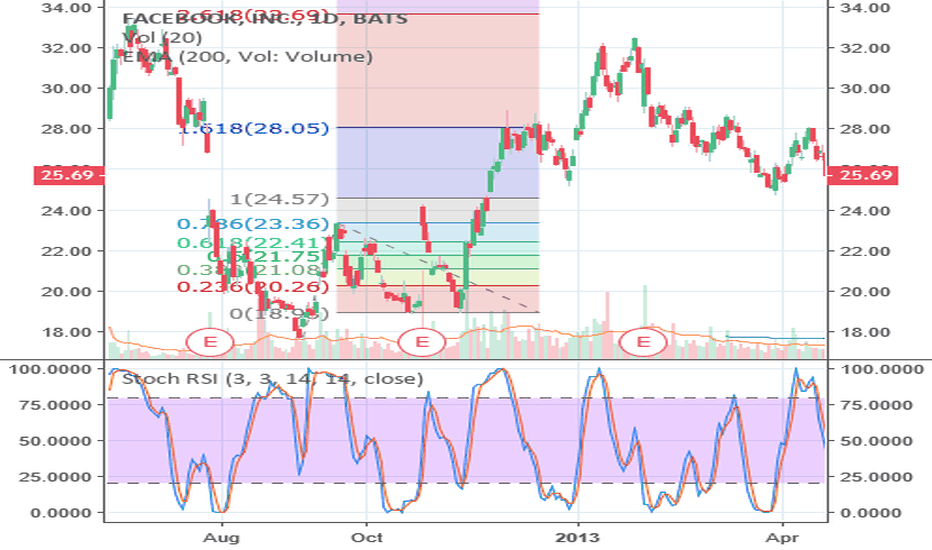
Please see attached similarities between RSI and market movements in early 2013 IPO of Facebook  FB, and early market movements of $DRIP. I see long term weakness in S&P500, till mid 2019 at least. Oil is going lower too.
I can see $30 DRIP by mid-January, and $68 DRIP by March to June. But this could go back to IPO too, but that will take much longer, (5-10 years).
Could be wrong, invest at your own risk. I'm just some guy on the internet.
FB, and early market movements of $DRIP. I see long term weakness in S&P500, till mid 2019 at least. Oil is going lower too.I can see $30
DRIP by mid-January, and $68 DRIP by March to June. But this could go back to IPO too, but that will take much longer, (5-10 years).Could be wrong, invest at your own risk. I'm just some guy on the internet.
עסקה פעילה
הערה
Trade still active. Aproaching $16 resistance, possible minor correction here, next target ~$19.עסקה פעילה
We are approaching my TP of 19, broke through $16 with a little resistance as expected. I expect the graph to meet great resistance at 19-22 range.הערה
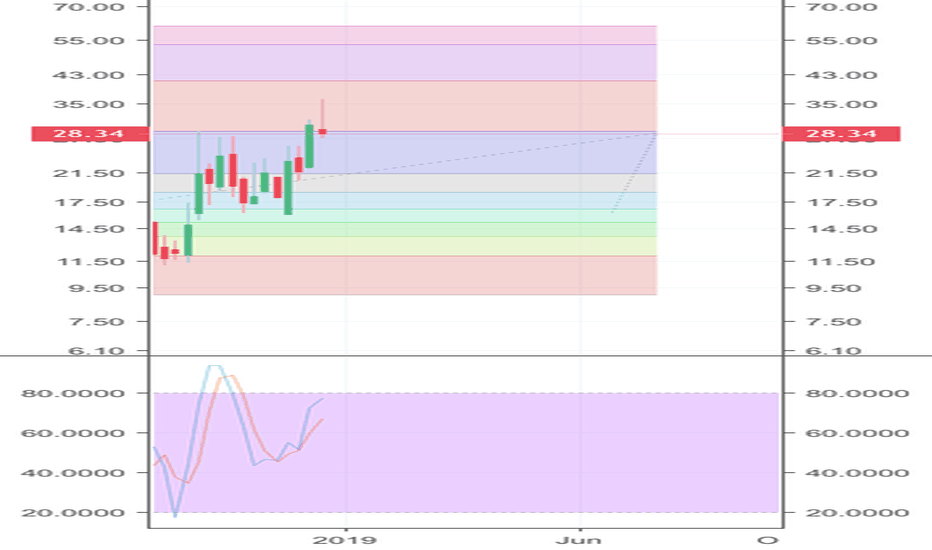
Consolidating for next rise to ~$33 Fibonacci level. We could hit this in the next two weeks, no later than February 1st.Please see my VIX chart for further details:

פרסומים קשורים
כתב ויתור
המידע והפרסומים אינם מיועדים להיות, ואינם מהווים, ייעוץ או המלצה פיננסית, השקעתית, מסחרית או מכל סוג אחר המסופקת או מאושרת על ידי TradingView. קרא עוד ב־תנאי השימוש.
פרסומים קשורים
כתב ויתור
המידע והפרסומים אינם מיועדים להיות, ואינם מהווים, ייעוץ או המלצה פיננסית, השקעתית, מסחרית או מכל סוג אחר המסופקת או מאושרת על ידי TradingView. קרא עוד ב־תנאי השימוש.