
Description:
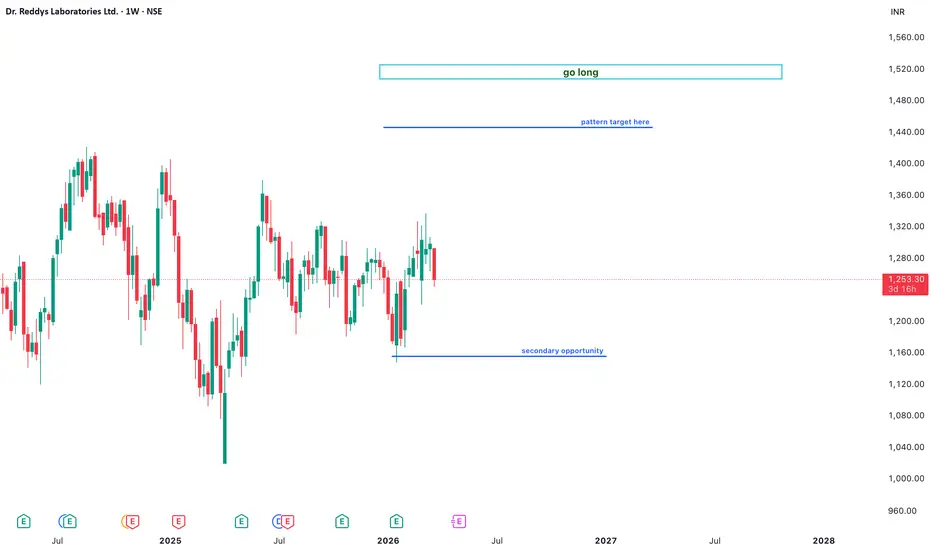
Analyzing the weekly structure of Dr. Reddy's Laboratories Ltd., the price action suggests a consolidating phase with a clear roadmap for bullish continuation.
Technical Observations:
Secondary Accumulation Zone: As marked on the chart, the lower level around 1,160 is a critical support area. "If the market reaches this level, it presents a high-probability secondary opportunity" for long positions.
Pattern Objective: The immediate resistance flip points toward a Pattern Target near the 1,450 zone.
The Long-Term Horizon: A decisive breakout above the pattern target clears the path to "Go Long" toward the ultimate objective zone near 1,520.
Execution Plan:
Bias: Bullish.
Entry Logic: Looking for accumulation at the support or a breakout above the immediate hurdle.
Target: Aiming for the 1,450 - 1,520 range in the mid-to-long term.
Disclaimer: Educational analysis based on weekly price action. Not financial advice.
Analyzing the weekly structure of Dr. Reddy's Laboratories Ltd., the price action suggests a consolidating phase with a clear roadmap for bullish continuation.
Technical Observations:
Secondary Accumulation Zone: As marked on the chart, the lower level around 1,160 is a critical support area. "If the market reaches this level, it presents a high-probability secondary opportunity" for long positions.
Pattern Objective: The immediate resistance flip points toward a Pattern Target near the 1,450 zone.
The Long-Term Horizon: A decisive breakout above the pattern target clears the path to "Go Long" toward the ultimate objective zone near 1,520.
Execution Plan:
Bias: Bullish.
Entry Logic: Looking for accumulation at the support or a breakout above the immediate hurdle.
Target: Aiming for the 1,450 - 1,520 range in the mid-to-long term.
Disclaimer: Educational analysis based on weekly price action. Not financial advice.

כתב ויתור
המידע והפרסומים אינם מיועדים להיות, ואינם מהווים, ייעוץ או המלצה פיננסית, השקעתית, מסחרית או מכל סוג אחר המסופקת או מאושרת על ידי TradingView. קרא עוד ב־תנאי השימוש.
כתב ויתור
המידע והפרסומים אינם מיועדים להיות, ואינם מהווים, ייעוץ או המלצה פיננסית, השקעתית, מסחרית או מכל סוג אחר המסופקת או מאושרת על ידי TradingView. קרא עוד ב־תנאי השימוש.