
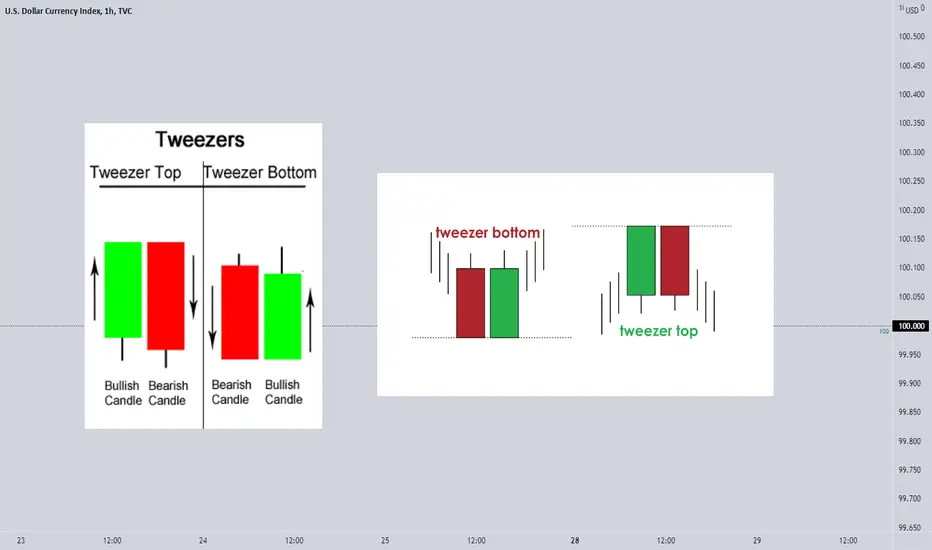
📉 A tweezer is a technical analysis pattern, commonly involving two candlesticks, that can signify either a market top or bottom. Tweezer bottoms are considered to be short-term bullish reversal patterns, whereas tweezer tops are thought to be bearish reversals.
📉 Tweezer top indicates a bearish reversal whereas Tweezer bottom indicates a bullish reversal. Tweezer top candlestick pattern occurs when the high of two candlesticks are almost or the same after an uptrend
📉 A Tweezer Bottom occurs during a downtrend when sellers push prices lower, often ending the session near the lows, but were not able to push the bottom any further. Tweezer Bottoms are considered to be short-term bullish reversal patterns that signal a market bottom.
A tweezers top is when two candles occur back to back with very similar highs. A tweezers bottom occurs when two candles, back to back, occur with very similar lows. The pattern is more important when there is a strong shift in momentum between the first candle and the second
Do you use twezzer tops or bottoms ?
📉 Tweezer top indicates a bearish reversal whereas Tweezer bottom indicates a bullish reversal. Tweezer top candlestick pattern occurs when the high of two candlesticks are almost or the same after an uptrend
📉 A Tweezer Bottom occurs during a downtrend when sellers push prices lower, often ending the session near the lows, but were not able to push the bottom any further. Tweezer Bottoms are considered to be short-term bullish reversal patterns that signal a market bottom.
A tweezers top is when two candles occur back to back with very similar highs. A tweezers bottom occurs when two candles, back to back, occur with very similar lows. The pattern is more important when there is a strong shift in momentum between the first candle and the second
Do you use twezzer tops or bottoms ?

כתב ויתור
המידע והפרסומים אינם מיועדים להיות, ואינם מהווים, ייעוץ או המלצה פיננסית, השקעתית, מסחרית או מכל סוג אחר המסופקת או מאושרת על ידי TradingView. קרא עוד ב־תנאי השימוש.
כתב ויתור
המידע והפרסומים אינם מיועדים להיות, ואינם מהווים, ייעוץ או המלצה פיננסית, השקעתית, מסחרית או מכל סוג אחר המסופקת או מאושרת על ידי TradingView. קרא עוד ב־תנאי השימוש.