
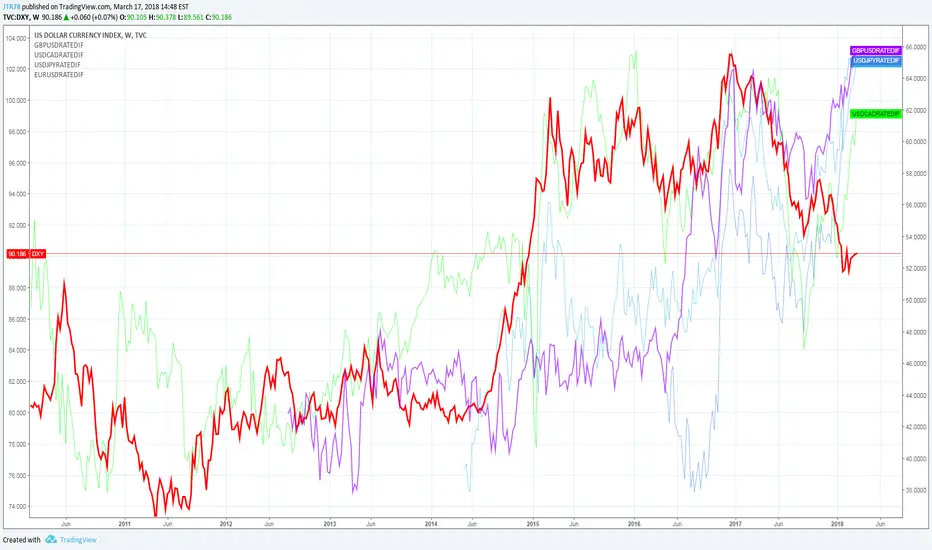
This line charts gives an idea how a currencies 10yr yield develop, relatively, vs the usd 10 yr yield. This goes only back to 2012-ish since no earlier data was available via the tickerdata. Trying to acquire new ticker data so we can make it complete up until the 90's. It should provide a clue where the USD is going short/medium term. Considering the output of this graph we can say that we are bullish usd with a possible target of at least 95 when rate hike happens next wednesday. Also its likely we will put a new 6-year high on the t-note when next ratehike happens. This is a major event.

כתב ויתור
המידע והפרסומים אינם מיועדים להיות, ואינם מהווים, ייעוץ או המלצה פיננסית, השקעתית, מסחרית או מכל סוג אחר המסופקת או מאושרת על ידי TradingView. קרא עוד ב־תנאי השימוש.
כתב ויתור
המידע והפרסומים אינם מיועדים להיות, ואינם מהווים, ייעוץ או המלצה פיננסית, השקעתית, מסחרית או מכל סוג אחר המסופקת או מאושרת על ידי TradingView. קרא עוד ב־תנאי השימוש.