
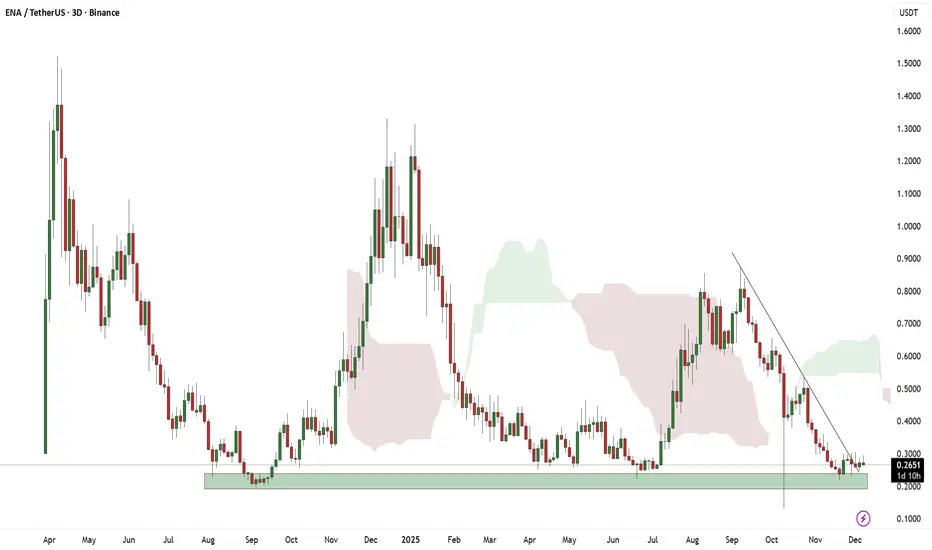
On the 3-day chart, ENA/USDT is trading inside a long-term demand zone where price has reacted multiple times in the past, showing that buyers have stepped in here before. The market has been in a downtrend for several months and is still moving under a descending trendline, showing weak momentum overall, but it is also holding above the same support area that previously triggered a strong bounce. Candles are small and volume looks low, which shows indecision, and the price is moving sideways near the bottom of the range instead of breaking down or starting a strong move yet. Until a clear move happens, the chart is showing consolidation near support after a long decline, meaning the market is in a waiting phase where buyers and sellers are trying to take control.

SpyOnGems (Mayank) | Technical Analysis & Education | Telegram: t.me/spyongems
כתב ויתור
המידע והפרסומים אינם מיועדים להיות, ואינם מהווים, ייעוץ או המלצה פיננסית, השקעתית, מסחרית או מכל סוג אחר המסופקת או מאושרת על ידי TradingView. קרא עוד ב־תנאי השימוש.
SpyOnGems (Mayank) | Technical Analysis & Education | Telegram: t.me/spyongems
כתב ויתור
המידע והפרסומים אינם מיועדים להיות, ואינם מהווים, ייעוץ או המלצה פיננסית, השקעתית, מסחרית או מכל סוג אחר המסופקת או מאושרת על ידי TradingView. קרא עוד ב־תנאי השימוש.