
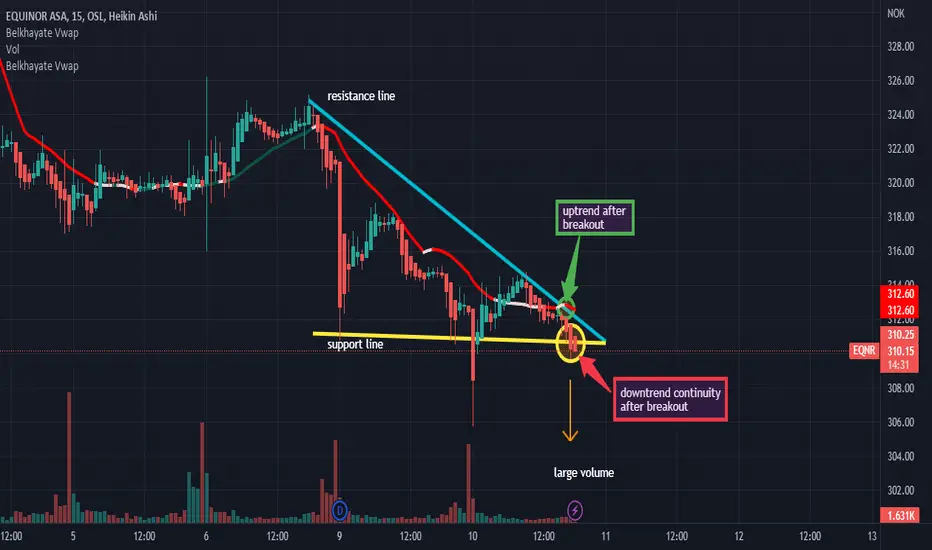
As you see on the chart we are in a downtrend so we will have a big probability of downtrend continuty after the breakout with force the support line by a big red candle with a large red volume. But, in other hand we could have a reversal trend (uptrend) after the breakout with force the vwap indicator and the resistance line by a big green candle with a large green volume. Thanks.

כתב ויתור
המידע והפרסומים אינם מיועדים להיות, ואינם מהווים, ייעוץ או המלצה פיננסית, השקעתית, מסחרית או מכל סוג אחר המסופקת או מאושרת על ידי TradingView. קרא עוד ב־תנאי השימוש.
כתב ויתור
המידע והפרסומים אינם מיועדים להיות, ואינם מהווים, ייעוץ או המלצה פיננסית, השקעתית, מסחרית או מכל סוג אחר המסופקת או מאושרת על ידי TradingView. קרא עוד ב־תנאי השימוש.