
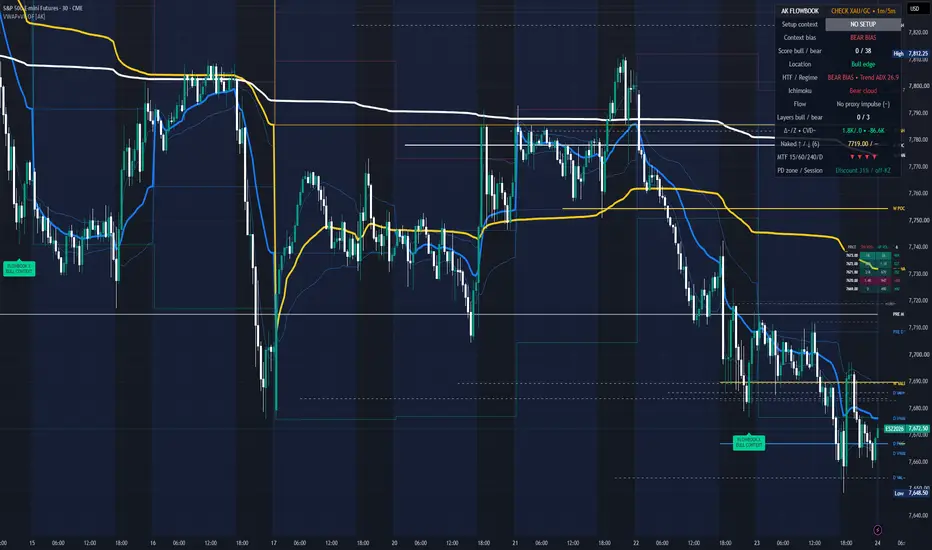
Two simple Market Profile tools tell you, period by period, who is in control of the auction: rotation factor and one-time framing. Below are the definitions, a live example from Friday's S&P futures session, and how they behaved over the last 22 sessions.
Data: CME E-mini S&P 500 futures (ES, December contract), 5-minute bars grouped into 30-minute periods, US cash session only (13:30-20:00 UTC, 13 periods). Volume levels on the chart come from the VWAP & Volume Profile Order Flow Map [AK FlowBook] indicator.
1) Rotation factor (RF)
Compare each 30-minute period with the one before it:
- high above the previous high: +1, below: -1, equal: 0
- low above the previous low: +1, below: -1, equal: 0
Add it up through the session. A strongly positive RF means buyers keep pushing both ends of the range higher; strongly negative means sellers do; a number near zero means the auction is rotating, not trending.
2) One-time framing (OTF)
- OTF up: every period holds a low at or above the previous period's low.
- OTF down: every period holds a high at or below the previous period's high.
While a market one-time-frames, only one side is active. The first period that takes out the opposite extreme ends it.
Live example: ES, Friday 23 Oct
- Open 7,661, 45.5 points below Thursday's cash close of 7,706.5.
- 14:00 period: low 7,648.5, the low of the day (inside target 1 of our S&P forecast that week).
- 14:00-16:00: OTF up. Lows 7,648.5, 7,655.25, 7,679.75, 7,681.25. Three periods in a row scored +2.
- 16:00: the period low 7,676.25 broke the previous 7,681.25. OTF up ended at the high 7,697.25.
- 15:30-20:00: highs 7,697.25, 7,693.75, 7,690.5, 7,677.5, 7,677.25, 7,675, 7,673.5, 7,671.25, 7,667.5. Every high lower than the one before, eight periods in a row: one-time framing down all afternoon, even though several lows held (scores of 0 at 17:30, 18:00 and 19:00).
- Session RF: -4. Close about 7,661, right back at the open.
So the morning buyers won the first two hours, then sellers framed the auction lower for four hours. The close-vs-open line says "flat day"; RF and OTF tell you who was really in charge, and when it changed.
What 22 sessions say (24 Sep - 23 Oct, cash session)
- RF sign matched the session direction (close vs open) on 15 of the 20 days where RF was not zero.
- Days with |RF| of 8 or more: 7, and 6 of them closed in the RF direction.
- Days that one-time-framed for at least the first 3 periods after the open: 8, and 7 of them closed in that direction (the exception was 13 Oct).
- Examples: 29 Sep framed down for 7 periods, closed 25 points under the open. 9 Oct framed up for 6 periods, closed 23 points above.
Small sample, one market, so treat these as tendencies, not rules.
Checklist
1. Mark each 30-minute period's high and low; score +1/-1 for each end.
2. Watch the running RF: big absolute numbers (+/-8 and beyond) are trend days.
3. Note whether the market is one-time framing, and in which direction.
4. The first period that breaks the opposite extreme is the earliest sign the other side stepped in.
5. Combine with location: OTF away from value is stronger than OTF inside yesterday's value.
Education, not a signal.

AK Order Flow · Gold order flow & volume education
Free Lite indicator + daily XAUUSD levels: akorderflow.com
Telegram: t.me/akorderflow · YouTube: @AKORDERFLOW
Education only, no signals.
Free Lite indicator + daily XAUUSD levels: akorderflow.com
Telegram: t.me/akorderflow · YouTube: @AKORDERFLOW
Education only, no signals.
כתב ויתור
המידע והפרסומים אינם מיועדים להיות, ואינם מהווים, ייעוץ או המלצה פיננסית, השקעתית, מסחרית או מכל סוג אחר המסופקת או מאושרת על ידי TradingView. קרא עוד ב־תנאי השימוש.