
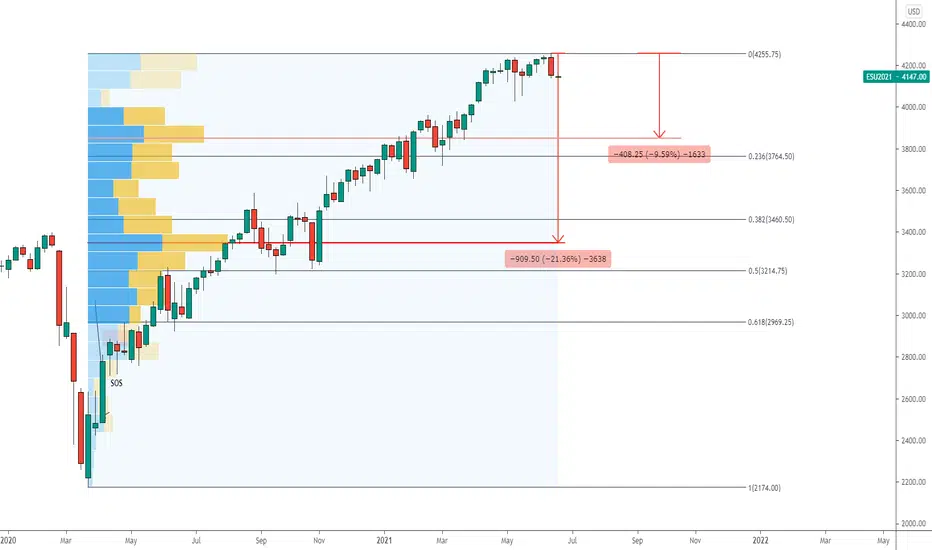
After a strong sell off -59pts or -1.39% (supply) for S&P 500 on last Friday, 18 June 2021, this is a potential start of a market correction.
Here are 2 key support levels to mark on the charts if index continues to fall.
1st Level: 3,850
High Volume Area
Fibo Retracement of 23.6%
10% fall from Peak
2nd Level: 3,400
High Volume Area
Fibo Retracement of 38.2%
20% fall from Peak
Here are 2 key support levels to mark on the charts if index continues to fall.
1st Level: 3,850
High Volume Area
Fibo Retracement of 23.6%
10% fall from Peak
2nd Level: 3,400
High Volume Area
Fibo Retracement of 38.2%
20% fall from Peak

כתב ויתור
המידע והפרסומים אינם מיועדים להיות, ואינם מהווים, ייעוץ או המלצה פיננסית, השקעתית, מסחרית או מכל סוג אחר המסופקת או מאושרת על ידי TradingView. קרא עוד ב־תנאי השימוש.
כתב ויתור
המידע והפרסומים אינם מיועדים להיות, ואינם מהווים, ייעוץ או המלצה פיננסית, השקעתית, מסחרית או מכל סוג אחר המסופקת או מאושרת על ידי TradingView. קרא עוד ב־תנאי השימוש.