לונג
BULL DOM
ESPORTS Deep Bull Signal Sitting on Top of a 110x Futures Ghost Market
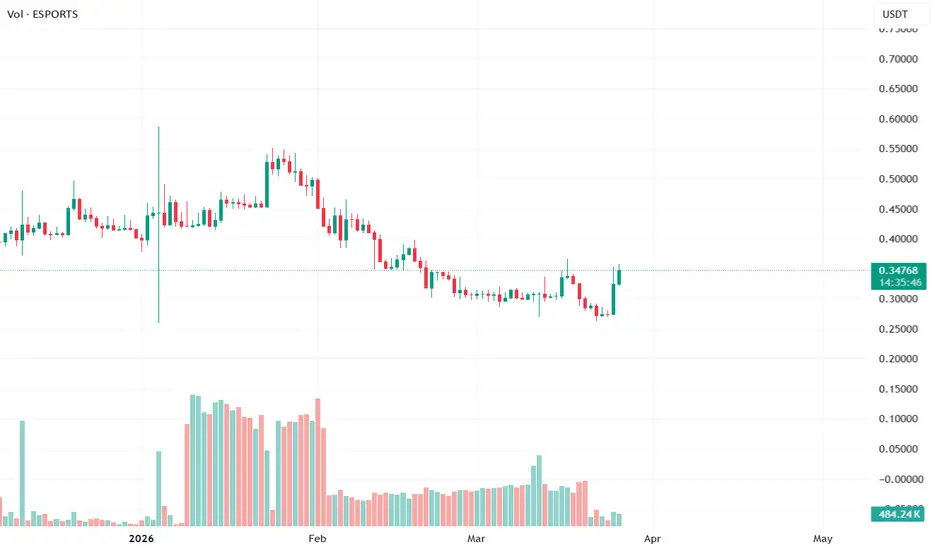
Spot at 0.34872, futures at 0.34806 — prices aligned but the volume tells a completely different story. Futures dollar volume at 31.37M against spot dollar volume at 284K gives a F/S ratio of 110x. Spot:Fut reads Fut Spec. This is not a legitimate move — this is the definition of a ghost market. Spot participation is essentially zero while futures volume is running parabolic. Deep Bull at 68.6% edge, 5.37x weight, 84.3% green reads clean on the surface. The leverage row invalidates the entire structure before the analysis begins.
44 green to 9 red out of 112 with strong alignment. EMA 7 green to 0 red — full uptrend across all timeframes. Candle 12 green to 2 red, Ichi TK 10 green to 3 red, C>T 12 green to 2 red. The signal panel is technically legitimate — real buyers did push price through BOS on the chart and established demand. Bull Cascade has printed twice in 4 bars with only 1.3% measured move remaining, meaning the pattern has nearly exhausted its target. SS/DD 2 green to 6 red — supply zones overhead remain unabsorbed. BW at 13.3% Normal with bull momentum descending. Backwardation at -0.19% Z -1.1 with yield -207% APY — mild futures discount, not extreme on its own.
Spot Z at -1.25 Low, SpotZ 1:5 falling at -0.05 — spot volume is below average and declining. Futures Z at 4.39 Parabolic, F+S Z at 4.09 Parabolic — the combined reading is being entirely driven by futures. Bull:Bear Z at 4.6 versus -0.7 Bull Dominant looks strong but in a Fut Spec environment this number reflects futures order flow, not real spot accumulation. OBV Z at -0.66 Inflow Normal — on-balance volume is mildly positive but cannot overcome the structural manipulation signal.
Leverage at 110.11x labeled Manip, percentile 100% Ceiling, AT Max printed 0 bars ago. This is the most dangerous combination the system can produce — leverage hit all-time maximum on the current bar simultaneously with parabolic futures volume at 110x spot. Every metric that measures speculative excess is simultaneously at its historical peak right now. AT Min sits 5780 bars ago at 0.0059x — the distance between floor and ceiling on this ticker is extraordinary, confirming this is a highly speculative asset with a history of extreme leverage cycling.
The chart shows a clean breakout structure with BOS confirmed, price trending up through demand, Bull Cascade printed twice. The visual pattern looks like a genuine breakout. This is exactly what makes the manipulation read dangerous — the chart and signal panel provide cover for what the volume and leverage data is screaming. Futures participants at 110x spot ratio with leverage at all-time ceiling are not buying for value. They are creating the appearance of momentum to exit into any spot volume that follows the signal.
The honest read: ESPORTS is a textbook ghost pump. Futures volume 110x above spot, leverage at all-time maximum on the current bar, Spot Z below average and falling, OBV only mildly positive, Bull Cascade with 1.3% left in the measured move. The bull signal panel and chart structure are real but they were manufactured by futures flow with no spot backing. Anyone buying spot here based on the visual breakout is providing exit liquidity for the futures position that created the move. Until Spot Z turns positive, F/S ratio drops below 10x, and leverage begins normalising from the ceiling, this setup is a trap regardless of how clean the EMA and candle alignment appears.
Is That Crypto Pump Real? Data Says No. Here's Why.
Stop Losing Money to Fake Volume. Find Real Moves Now.
Trade the REAL Crypto Volume. Stop Getting Faked Out.
Spot at 0.34872, futures at 0.34806 — prices aligned but the volume tells a completely different story. Futures dollar volume at 31.37M against spot dollar volume at 284K gives a F/S ratio of 110x. Spot:Fut reads Fut Spec. This is not a legitimate move — this is the definition of a ghost market. Spot participation is essentially zero while futures volume is running parabolic. Deep Bull at 68.6% edge, 5.37x weight, 84.3% green reads clean on the surface. The leverage row invalidates the entire structure before the analysis begins.
44 green to 9 red out of 112 with strong alignment. EMA 7 green to 0 red — full uptrend across all timeframes. Candle 12 green to 2 red, Ichi TK 10 green to 3 red, C>T 12 green to 2 red. The signal panel is technically legitimate — real buyers did push price through BOS on the chart and established demand. Bull Cascade has printed twice in 4 bars with only 1.3% measured move remaining, meaning the pattern has nearly exhausted its target. SS/DD 2 green to 6 red — supply zones overhead remain unabsorbed. BW at 13.3% Normal with bull momentum descending. Backwardation at -0.19% Z -1.1 with yield -207% APY — mild futures discount, not extreme on its own.
Spot Z at -1.25 Low, SpotZ 1:5 falling at -0.05 — spot volume is below average and declining. Futures Z at 4.39 Parabolic, F+S Z at 4.09 Parabolic — the combined reading is being entirely driven by futures. Bull:Bear Z at 4.6 versus -0.7 Bull Dominant looks strong but in a Fut Spec environment this number reflects futures order flow, not real spot accumulation. OBV Z at -0.66 Inflow Normal — on-balance volume is mildly positive but cannot overcome the structural manipulation signal.
Leverage at 110.11x labeled Manip, percentile 100% Ceiling, AT Max printed 0 bars ago. This is the most dangerous combination the system can produce — leverage hit all-time maximum on the current bar simultaneously with parabolic futures volume at 110x spot. Every metric that measures speculative excess is simultaneously at its historical peak right now. AT Min sits 5780 bars ago at 0.0059x — the distance between floor and ceiling on this ticker is extraordinary, confirming this is a highly speculative asset with a history of extreme leverage cycling.
The chart shows a clean breakout structure with BOS confirmed, price trending up through demand, Bull Cascade printed twice. The visual pattern looks like a genuine breakout. This is exactly what makes the manipulation read dangerous — the chart and signal panel provide cover for what the volume and leverage data is screaming. Futures participants at 110x spot ratio with leverage at all-time ceiling are not buying for value. They are creating the appearance of momentum to exit into any spot volume that follows the signal.
The honest read: ESPORTS is a textbook ghost pump. Futures volume 110x above spot, leverage at all-time maximum on the current bar, Spot Z below average and falling, OBV only mildly positive, Bull Cascade with 1.3% left in the measured move. The bull signal panel and chart structure are real but they were manufactured by futures flow with no spot backing. Anyone buying spot here based on the visual breakout is providing exit liquidity for the futures position that created the move. Until Spot Z turns positive, F/S ratio drops below 10x, and leverage begins normalising from the ceiling, this setup is a trap regardless of how clean the EMA and candle alignment appears.
Is That Crypto Pump Real? Data Says No. Here's Why.
Stop Losing Money to Fake Volume. Find Real Moves Now.
Trade the REAL Crypto Volume. Stop Getting Faked Out.

5 TradingView Premium Indicators : Real Volume. Real Signals. 3-day free trial 👇whop.com/volume-hunter/ tiktok.com/@volume_hunter t.me/volume_hunter Forex | Stocks | ETFs | Indices | Options
כתב ויתור
המידע והפרסומים אינם מיועדים להיות, ואינם מהווים, ייעוץ או המלצה פיננסית, השקעתית, מסחרית או מכל סוג אחר המסופקת או מאושרת על ידי TradingView. קרא עוד ב־תנאי השימוש.
5 TradingView Premium Indicators : Real Volume. Real Signals. 3-day free trial 👇whop.com/volume-hunter/ tiktok.com/@volume_hunter t.me/volume_hunter Forex | Stocks | ETFs | Indices | Options
כתב ויתור
המידע והפרסומים אינם מיועדים להיות, ואינם מהווים, ייעוץ או המלצה פיננסית, השקעתית, מסחרית או מכל סוג אחר המסופקת או מאושרת על ידי TradingView. קרא עוד ב־תנאי השימוש.