
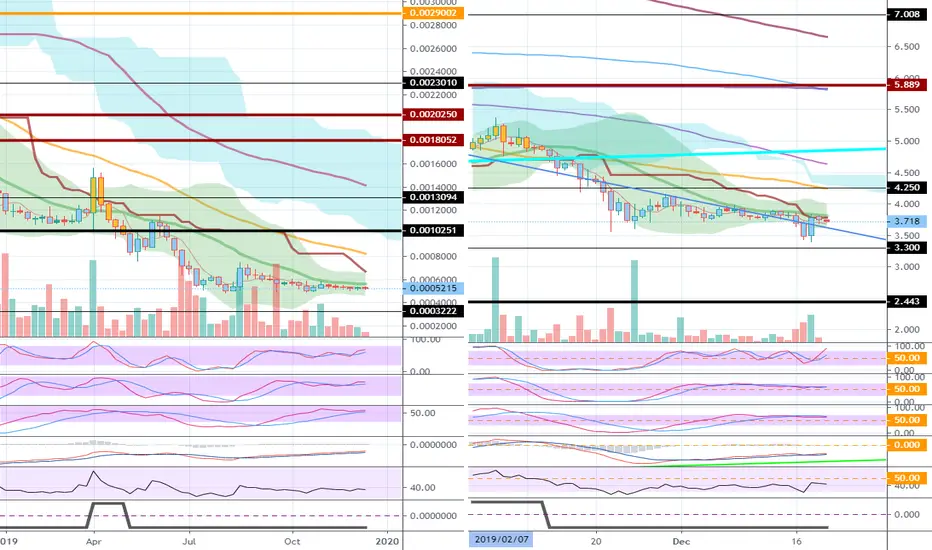
On the ETCBTC chart,
Below 0.0010251 is a long-term investment area.
In the ETCUSD chart,
It is moving around the downtrend line.
You should check if you can move outside of the downward trend line.
----------------
It is expected to take a long time to raise prices in the normal market flow.
Below 0.0010251 is a long-term investment area.
In the ETCUSD chart,
It is moving around the downtrend line.
You should check if you can move outside of the downward trend line.
----------------
It is expected to take a long time to raise prices in the normal market flow.

[Practical trading strategy using HA-MS and SBOD]
youtu.be/aceN1AttX1Y
youtu.be/aceN1AttX1Y
פרסומים קשורים
כתב ויתור
המידע והפרסומים אינם מיועדים להיות, ואינם מהווים, ייעוץ או המלצה פיננסית, השקעתית, מסחרית או מכל סוג אחר המסופקת או מאושרת על ידי TradingView. קרא עוד ב־תנאי השימוש.
[Practical trading strategy using HA-MS and SBOD]
youtu.be/aceN1AttX1Y
youtu.be/aceN1AttX1Y
פרסומים קשורים
כתב ויתור
המידע והפרסומים אינם מיועדים להיות, ואינם מהווים, ייעוץ או המלצה פיננסית, השקעתית, מסחרית או מכל סוג אחר המסופקת או מאושרת על ידי TradingView. קרא עוד ב־תנאי השימוש.