
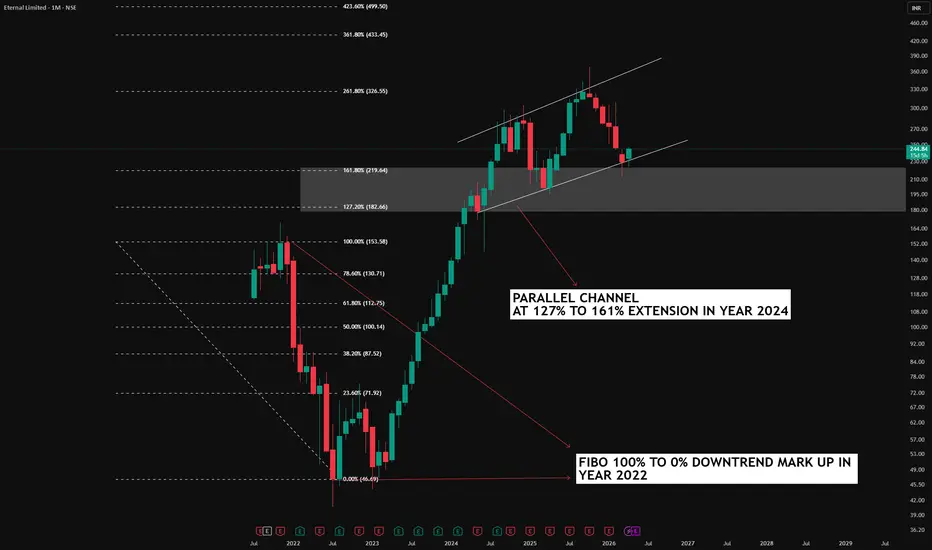
Fibonacci retracement and extension are tools used to map possible support, resistance, and price projection levels based on a prior move. In this chart, the Fibonacci extension was drawn from the top to the bottom of the 2022 move, and the key extension zones like 127% and 161% were used as reference areas where price could react later. These levels do not predict the market with certainty, but they help highlight areas where price may pause, reverse, or continue.
A parallel channel is a trend structure drawn by connecting swing highs and swing lows with two lines that run parallel to each other. It helps show the direction of the trend and the possible boundaries within which price may move. When price respects both a Fibonacci extension zone and a parallel channel, it can suggest that the market is responding to both time-tested structure.
In this setup, the 2022 bottom, the 2022 high, the extension zone, and the later 2024 reaction are all part of the same broader market structure. The chart is not meant to say the market must move in one direction; it simply shows how these technical tools can be used to observe possible reaction zones. Traders often use such confluence to build a more balanced view of price behavior rather than relying on a single indicator.
Key Terms Used:
Disclaimer:
This post is for educational purposes only and should not be considered investment advice. Markets can behave differently from one setup to another, so always use your own analysis and risk management before making any trading decision.
A parallel channel is a trend structure drawn by connecting swing highs and swing lows with two lines that run parallel to each other. It helps show the direction of the trend and the possible boundaries within which price may move. When price respects both a Fibonacci extension zone and a parallel channel, it can suggest that the market is responding to both time-tested structure.
In this setup, the 2022 bottom, the 2022 high, the extension zone, and the later 2024 reaction are all part of the same broader market structure. The chart is not meant to say the market must move in one direction; it simply shows how these technical tools can be used to observe possible reaction zones. Traders often use such confluence to build a more balanced view of price behavior rather than relying on a single indicator.
Key Terms Used:
- Fibonacci Extension
- 127% Extension
- 161% Extension
- Parallel Channel
Disclaimer:
This post is for educational purposes only and should not be considered investment advice. Markets can behave differently from one setup to another, so always use your own analysis and risk management before making any trading decision.

📊Swing & positional equity research with Buy, Sell and Hold recommendations.
Contact
📞WhatsApp: wa.me/919455664601
💬Telegram DM: t.me/Apoorv_HH
📢Join Telegram channel: t.me/hashtaghammer
Apoorv Dubey|SEBI RA INH000030287
Contact
📞WhatsApp: wa.me/919455664601
💬Telegram DM: t.me/Apoorv_HH
📢Join Telegram channel: t.me/hashtaghammer
Apoorv Dubey|SEBI RA INH000030287
פרסומים קשורים
כתב ויתור
המידע והפרסומים אינם מיועדים להיות, ואינם מהווים, ייעוץ או המלצה פיננסית, השקעתית, מסחרית או מכל סוג אחר המסופקת או מאושרת על ידי TradingView. קרא עוד ב־תנאי השימוש.