
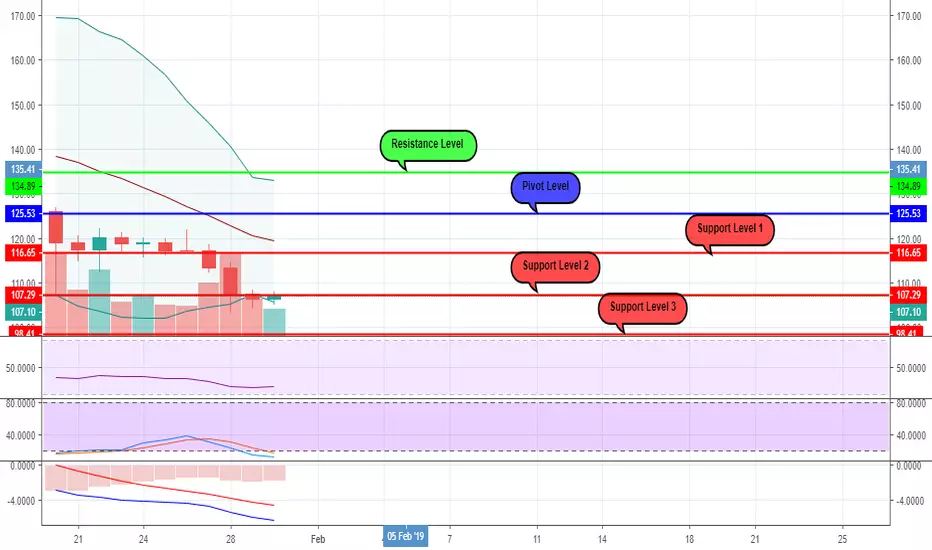
As we have mentioned on the previous post about Ethereum, the price has registered a bearish trend since the 10th of January, once it crossed and stabilized below the 20 days Moving Average, with it's daily range movements decreasing as well.
Like before, the RSI and the Stochastic still have "oversold" positions and on top of this, we can also add the position of the price close to the lower standard deviation of the Bollinger Bands which is indicating the same possible "correction".
But, as long as the MACD will stay below the Signal it is possible to see a continuation of the sideways movements, rather than a consistent price increase, with an attempt of "breaking" the level of 100$ in the following days.
Like before, the RSI and the Stochastic still have "oversold" positions and on top of this, we can also add the position of the price close to the lower standard deviation of the Bollinger Bands which is indicating the same possible "correction".
But, as long as the MACD will stay below the Signal it is possible to see a continuation of the sideways movements, rather than a consistent price increase, with an attempt of "breaking" the level of 100$ in the following days.

פרסומים קשורים
כתב ויתור
המידע והפרסומים אינם מיועדים להיות, ואינם מהווים, ייעוץ או המלצה פיננסית, השקעתית, מסחרית או מכל סוג אחר המסופקת או מאושרת על ידי TradingView. קרא עוד ב־תנאי השימוש.
פרסומים קשורים
כתב ויתור
המידע והפרסומים אינם מיועדים להיות, ואינם מהווים, ייעוץ או המלצה פיננסית, השקעתית, מסחרית או מכל סוג אחר המסופקת או מאושרת על ידי TradingView. קרא עוד ב־תנאי השימוש.