
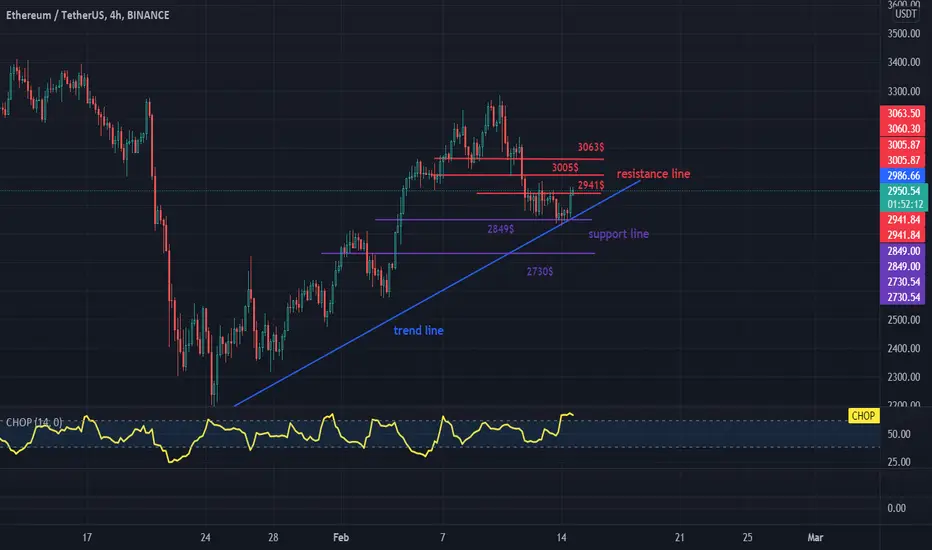
Hi everyone, let's take a look at the ETH to USDT chart on the 4 hour timeframe.
Let's start by marking the local uptrend in blue as you can see that the price has rebounded on it.
The first support is $ 2,849 and the next is around $ 2,730.
Currently, the price is just above the resistance at $ 2,941 equal to 0.236 Fib retracement. If we manage to break it, the next resistance should be encountered at the levels: $ 3005 and $ 3063.
It is worth paying attention to the CHOP indicator, which shows a lot of energy and observe which side it will be used in.
Let's start by marking the local uptrend in blue as you can see that the price has rebounded on it.
The first support is $ 2,849 and the next is around $ 2,730.
Currently, the price is just above the resistance at $ 2,941 equal to 0.236 Fib retracement. If we manage to break it, the next resistance should be encountered at the levels: $ 3005 and $ 3063.
It is worth paying attention to the CHOP indicator, which shows a lot of energy and observe which side it will be used in.

כתב ויתור
המידע והפרסומים אינם מיועדים להיות, ואינם מהווים, ייעוץ או המלצה פיננסית, השקעתית, מסחרית או מכל סוג אחר המסופקת או מאושרת על ידי TradingView. קרא עוד ב־תנאי השימוש.
כתב ויתור
המידע והפרסומים אינם מיועדים להיות, ואינם מהווים, ייעוץ או המלצה פיננסית, השקעתית, מסחרית או מכל סוג אחר המסופקת או מאושרת על ידי TradingView. קרא עוד ב־תנאי השימוש.