
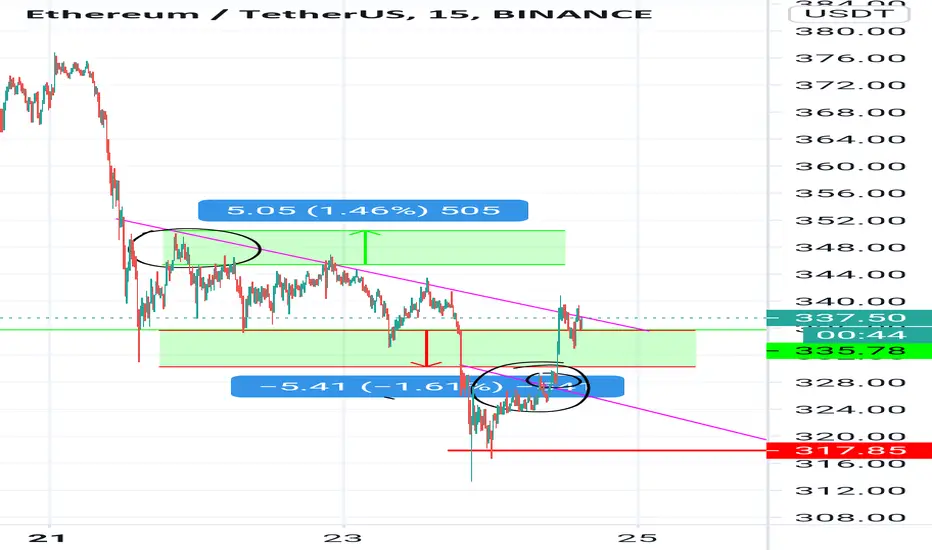
In the graph I have rounded two points..the curves look similar but difference between two moves are..the above curve retested the resistance level..but it took downward path..
The below curve why it exploded up? The reason is after retest near the resistance it consolidated near the resistance that's a indicator of a bullish move..the inner circle below circled one is the consolidated area
The below curve why it exploded up? The reason is after retest near the resistance it consolidated near the resistance that's a indicator of a bullish move..the inner circle below circled one is the consolidated area
עסקה סגורה: היעד הושג
If u guys watch the move in 5m time frame it would be a better clarity
כתב ויתור
המידע והפרסומים אינם מיועדים להיות, ואינם מהווים, ייעוץ או המלצה פיננסית, השקעתית, מסחרית או מכל סוג אחר המסופקת או מאושרת על ידי TradingView. קרא עוד ב־תנאי השימוש.
כתב ויתור
המידע והפרסומים אינם מיועדים להיות, ואינם מהווים, ייעוץ או המלצה פיננסית, השקעתית, מסחרית או מכל סוג אחר המסופקת או מאושרת על ידי TradingView. קרא עוד ב־תנאי השימוש.