
Lesson 8 - Corrective Triangles
Difficulty: (Intermediate to Advanced)
Some corrections fall. Some drift sideways and slowly squeeze until the chart looks like nothing is happening at all. That second kind has five legs, a name, and — more usefully — a fairly specific message about how much of the larger move may be left.

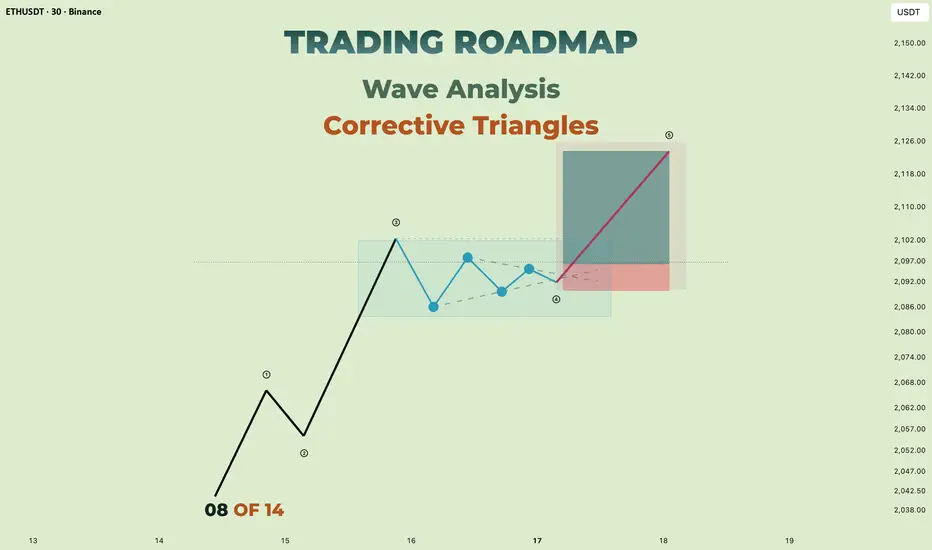
A contracting correction between two converging boundaries. Five legs, labelled A through E, each one covering less ground than the one before it. The quiet stretch of a chart is often the part carrying the most information about what comes next.
🔵 QUICK RECAP FROM LESSON 7
Lesson 7 covered extensions — one motive leg running far past the other two, subdividing into its own five waves, and producing a sequence that can show nine visible legs rather than five.
That lesson was about motive structure. This one returns to correction. Triangles are the sideways branch of the corrective family introduced in Lesson 3, and they behave differently enough from zigzags and flats to deserve their own treatment.
🔵 1. WHAT A TRIANGLE IS
A triangle is a corrective pattern built from five legs, labelled A-B-C-D-E, where each leg subdivides into three smaller waves.
Three features define it:
- Five legs, not three — zigzags and flats are three-legged (A-B-C); a triangle adds D and E
- Overlapping structure — the legs trade back through each other rather than making clean progress in either direction
- Converging or diverging boundaries — two lines, one across the ends of A and C, one across the ends of B and D
Range and volume typically decline through the pattern. The market is not deciding a new direction here — it is consuming time while the previous trend rests.
🐳 Pro Tip: If you count three legs and the structure is still moving sideways, wait before naming it. Many flats reveal a fourth and fifth leg if given room. Naming a triangle too early is one of the more common ways a workable count gets abandoned.
🔵 2. WHERE TRIANGLES APPEAR
This is the part that gives triangles their practical value. They do not show up anywhere in a sequence — they favour specific positions:
- Wave 4 of an impulse — the most frequent location by a wide margin
- Wave B of an A-B-C correction
- Wave X connecting two corrective structures in a combination
- The final leg of a larger, complex correction
What they very rarely are is Wave 2. Second waves tend to be sharp and deep — the personality described in Lesson 5 — while triangles are slow and shallow.
The useful consequence: identifying a triangle tells you roughly where you are. A triangle usually appears in the position immediately before the final move of the larger structure. After a Wave 4 triangle, what typically follows is Wave 5. After a Wave B triangle, what follows is Wave C.

A triangle occupying the fourth wave position of a five-wave advance. It absorbed time rather than price, and stayed clear of Wave 1 territory — the first rule from Lesson 4 holding with visible margin. What followed it was the fifth and final leg of the sequence.
🐳 Pro Tip: "One more leg to go" is the single most useful thing a triangle tells you. It does not say how large that leg will be — but knowing the move after the triangle is likely the last one of its degree changes how you would manage a position through it.
🔵 3. THE FIVE TRIANGLE TYPES
Four contracting variations and one expanding.
Contracting — both boundaries converge and each leg generally covers less ground than the one before:
- Symmetrical — upper boundary sloping down, lower boundary sloping up, at broadly similar angles. The most common form
- Ascending — a roughly flat upper boundary with a rising lower boundary
- Descending — a roughly flat lower boundary with a falling upper boundary
- Running — a contracting triangle in which wave B travels beyond the start of wave A, tilting the whole pattern in the direction of the larger trend
Expanding — the boundaries diverge and each leg tends to be larger than the last. Much less common, considerably harder to work with, and prone to repeated false breaks in both directions.

The five variations drawn side by side. The differences are in the slope of the two boundaries, not in the underlying five-leg A-B-C-D-E count, which is the same in all of them. The expanding version is separated on the right because it behaves differently from the other four.
🐳 Pro Tip: Ascending and descending describe the shape, not a guaranteed direction. Treating "ascending triangle" as an automatic long ignores that the position in the larger sequence — Wave 4 of a decline, for instance — often matters more than the shape does.
🔵 4. THE RULES AND GUIDELINES
Triangles are more permissive than impulses, but not unconstrained.
Working rules:
- Five legs: A, B, C, D, E
- Each leg subdivides into three waves — commonly 3-3-3-3-3
- Wave C may not move beyond the end of wave A
- Wave D may not move beyond the end of wave B
- Wave E may not move beyond the end of wave C
Guidelines that hold often, but not always:
- Each leg retraces roughly 61.8% of the leg before it in a contracting triangle
- Wave E is frequently the most awkward leg — it can undershoot its boundary, or briefly overshoot before the pattern resolves
- One leg, often C or E, may subdivide into a more complex structure than the others
- Range and volume tend to contract steadily, then expand as the pattern resolves
🐳 Pro Tip: Wave E poking through the boundary line and immediately reversing is common enough that it should not, on its own, invalidate the count. What breaks the pattern is a leg violating one of the working rules above — not a wick crossing a line you drew yourself.
🔵 5. THE THRUST — MEASURING WHAT COMES NEXT
The move out of a triangle is often called the thrust, and it is one of the few places in wave analysis offering a reasonably direct measurement.
- Take the widest part of the pattern — the vertical distance between its highest and lowest points, which in practice is usually the span of wave A
- Project that distance from the point where price left the pattern
- In a Wave 4 triangle, that projection often lands near the Wave 5 target you would already have from the Fibonacci work in Lesson 6
That last point is the one worth acting on. Two independent methods — a triangle thrust and a Fibonacci projection — pointing at the same area is a stronger read than either on its own.

The widest part of the pattern measured on the left, then the same distance projected from the point where price left the boundary. The thrust reached the general area of the projection. An area, not a precise level — overshoots and undershoots are both ordinary.
🐳 Pro Tip: A thrust that fails quickly and drops back inside the boundaries is a meaningful warning. It often means the pattern was not finished, or that the larger count needs revisiting. Falling straight back inside is not something a healthy resolution usually does.
🔵 6. TIME, AND WHY TRIANGLES TEST PATIENCE
Triangles consume time rather than price, which makes them psychologically the hardest correction to sit through.
- Range narrows, volatility drops, and the chart looks like it has stopped working
- Both breakout directions get tested repeatedly inside the pattern, so momentum entries tend to be whipsawed
- Traders who entered before the triangle began often exit somewhere in the middle of it, shortly before the resolving move
The apex — where the two boundaries would meet — is sometimes used as a loose timing reference, with resolution often arriving somewhere between 60% and 80% of the way toward it. Treat that as an expectation, not a schedule.
🐳 Pro Tip: The strongest practical use of a triangle is not the entry. It is knowing to hold. If the triangle sits in the Wave 4 position, the noise you are sitting through is the pause before the final leg — not the reversal it feels like at the time.
🔵 7. TRIANGLE OR RANGE?
Not every sideways stretch is a triangle. A quick set of checks:
- Leg count — a triangle has five, each subdividing into three. A range has whatever count price happened to produce
- Boundary discipline — the A-C and B-D lines should be reasonably clean. If it takes three attempts to draw them, they may not be there
- Position — a triangle in the Wave 4 or Wave B slot fits the framework. One in a Wave 2 slot should make you suspicious of the labels
- Contraction — range and volume should be declining through the pattern, not flat or expanding
If more than one of these fails, treating the structure as a plain range and waiting is usually a better decision than forcing a triangle label onto it.

Two sideways stretches. The left shows five contracting legs against converging boundaries; the right is a range between two horizontal levels with no reliable leg count. Only one of them supports a triangle reading — and only one of them supports a thrust projection.
🐳 Pro Tip: The cost of mislabelling a range as a triangle is not just a poor entry — it is the projection. A thrust measured from a structure that was never a triangle produces a target with nothing behind it.
🔵 8. THE SAME PAUSE IN TWO LANGUAGES
Everything above rests on labels you placed yourself. That is the honest weak point of any wave method, and it is worth describing the same stretch of chart a second time in a language that owes nothing to Elliott.
Market structure is that language. It asks one question: is the market still taking out its prior swings in the same direction?
What a triangle looks like structurally.
Read this way, a triangle is a stretch where neither side is producing structure breaks. Each leg fails to take out the extreme before it. The trend has not been contradicted — a break of structure against the prior direction never arrives — but it is not being confirmed either. That combination, no confirmation and no contradiction, is a fairly precise structural description of a pause.
The zone underneath it.
The leg that preceded the triangle was usually the fast one, and fast legs tend to leave behind areas the market departed from without trading back into them. Those areas exist on the chart the moment the acceleration happens, without any labelling. Triangles frequently form around one of them, which is part of why a Wave 4 often stalls somewhere that looks arbitrary on a count but obvious on a structural read.

One advance described twice. The count reads a five-wave sequence with a triangle in the fourth wave. Underneath, the change of character near the beginning marks the turn, each new extreme registers as a break of structure in the same direction, and the shaded area marks a zone the market accelerated away from — the region the sideways pause settled into. Note where the second break of structure falls: at the point price left the triangle, which is the thrust from Section 5 arriving under a different name. Neither reading proves the other; they arrive at the same place from different starting points.
🐳 Pro Tip: The bridge to Section 5 is direct. Structurally, the thrust is simply the first break of structure after a stretch that produced none. That break and the boundary break are usually the same event described twice — which is why a thrust that immediately fails tends to look wrong in both languages at once.
🐳 Pro Tip: Use the disagreements, not only the agreements. If the count says a triangle is still forming but structure has already broken the other way, that gap is information — and it is usually the count worth rechecking first.
🔵 COMMON MISTAKES
- Naming a triangle after three legs, before D and E have formed
- Reading ascending and descending shapes as directional signals independent of position in the sequence
- Abandoning the count when wave E briefly pierces its boundary line
- Projecting a thrust from a structure with no clean leg count
- Expecting a triangle in the Wave 2 position
- Trading inside the pattern on momentum, where whipsaws are most likely
- Reading a Wave 4 triangle as a trend reversal rather than the pause before the final leg
- Letting the wave count be the only reading on the chart, so nothing independent can disagree with it
🔵 QUICK SELF-CHECK
- Open a completed trend and find a sideways stretch inside it
- Count the legs — five, and does each subdivide into three?
- Draw the A-C and B-D boundaries and check whether they converge, diverge, or neither
- Identify which of the five types it most resembles
- Measure the widest part, project it from the breakout, and compare against what price actually did
- Check the position in the larger sequence — Wave 4, Wave B, or something that does not fit
- Describe the same stretch structurally and confirm no break occurred against the prior trend while it formed
🔵 WHAT IS NEXT
Lesson 9 — Combinations and Complex Corrections: what happens when one corrective pattern is not enough, how W-X-Y and W-X-Y-X-Z structures are built, and why the connecting X wave is where most complex counts come apart.
A quiet chart is not an empty one. The stretches where nothing appears to be happening are often where the structure is doing its most specific work — and where most of the information sits unclaimed.
Full Trading Roadmap | Wave Analysis Course
Trading Roadmap | Wave Analysis · Lesson 01 — Wave Analysis Foundations
Trading Roadmap | Wave Analysis · Lesson 02 — Impulse Waves (5-Wave Structure)
Trading Roadmap | Wave Analysis · Lesson 03 — Corrective Waves (A-B-C)
Trading Roadmap | Wave Analysis · Lesson 04 — The Rules of Elliott
Trading Roadmap | Wave Analysis · Lesson 05 — Wave Personality
Trading Roadmap | Wave Analysis · Lesson 06 — Fibonacci with Elliott
Trading Roadmap | Wave Analysis · Lesson 07 — Extended Waves
Best Regards, BigBeluga 🐳
Difficulty: (Intermediate to Advanced)
Some corrections fall. Some drift sideways and slowly squeeze until the chart looks like nothing is happening at all. That second kind has five legs, a name, and — more usefully — a fairly specific message about how much of the larger move may be left.
A contracting correction between two converging boundaries. Five legs, labelled A through E, each one covering less ground than the one before it. The quiet stretch of a chart is often the part carrying the most information about what comes next.
🔵 QUICK RECAP FROM LESSON 7
Lesson 7 covered extensions — one motive leg running far past the other two, subdividing into its own five waves, and producing a sequence that can show nine visible legs rather than five.
That lesson was about motive structure. This one returns to correction. Triangles are the sideways branch of the corrective family introduced in Lesson 3, and they behave differently enough from zigzags and flats to deserve their own treatment.
🔵 1. WHAT A TRIANGLE IS
A triangle is a corrective pattern built from five legs, labelled A-B-C-D-E, where each leg subdivides into three smaller waves.
Three features define it:
- Five legs, not three — zigzags and flats are three-legged (A-B-C); a triangle adds D and E
- Overlapping structure — the legs trade back through each other rather than making clean progress in either direction
- Converging or diverging boundaries — two lines, one across the ends of A and C, one across the ends of B and D
Range and volume typically decline through the pattern. The market is not deciding a new direction here — it is consuming time while the previous trend rests.
🐳 Pro Tip: If you count three legs and the structure is still moving sideways, wait before naming it. Many flats reveal a fourth and fifth leg if given room. Naming a triangle too early is one of the more common ways a workable count gets abandoned.
🔵 2. WHERE TRIANGLES APPEAR
This is the part that gives triangles their practical value. They do not show up anywhere in a sequence — they favour specific positions:
- Wave 4 of an impulse — the most frequent location by a wide margin
- Wave B of an A-B-C correction
- Wave X connecting two corrective structures in a combination
- The final leg of a larger, complex correction
What they very rarely are is Wave 2. Second waves tend to be sharp and deep — the personality described in Lesson 5 — while triangles are slow and shallow.
The useful consequence: identifying a triangle tells you roughly where you are. A triangle usually appears in the position immediately before the final move of the larger structure. After a Wave 4 triangle, what typically follows is Wave 5. After a Wave B triangle, what follows is Wave C.
A triangle occupying the fourth wave position of a five-wave advance. It absorbed time rather than price, and stayed clear of Wave 1 territory — the first rule from Lesson 4 holding with visible margin. What followed it was the fifth and final leg of the sequence.
🐳 Pro Tip: "One more leg to go" is the single most useful thing a triangle tells you. It does not say how large that leg will be — but knowing the move after the triangle is likely the last one of its degree changes how you would manage a position through it.
🔵 3. THE FIVE TRIANGLE TYPES
Four contracting variations and one expanding.
Contracting — both boundaries converge and each leg generally covers less ground than the one before:
- Symmetrical — upper boundary sloping down, lower boundary sloping up, at broadly similar angles. The most common form
- Ascending — a roughly flat upper boundary with a rising lower boundary
- Descending — a roughly flat lower boundary with a falling upper boundary
- Running — a contracting triangle in which wave B travels beyond the start of wave A, tilting the whole pattern in the direction of the larger trend
Expanding — the boundaries diverge and each leg tends to be larger than the last. Much less common, considerably harder to work with, and prone to repeated false breaks in both directions.
The five variations drawn side by side. The differences are in the slope of the two boundaries, not in the underlying five-leg A-B-C-D-E count, which is the same in all of them. The expanding version is separated on the right because it behaves differently from the other four.
🐳 Pro Tip: Ascending and descending describe the shape, not a guaranteed direction. Treating "ascending triangle" as an automatic long ignores that the position in the larger sequence — Wave 4 of a decline, for instance — often matters more than the shape does.
🔵 4. THE RULES AND GUIDELINES
Triangles are more permissive than impulses, but not unconstrained.
Working rules:
- Five legs: A, B, C, D, E
- Each leg subdivides into three waves — commonly 3-3-3-3-3
- Wave C may not move beyond the end of wave A
- Wave D may not move beyond the end of wave B
- Wave E may not move beyond the end of wave C
Guidelines that hold often, but not always:
- Each leg retraces roughly 61.8% of the leg before it in a contracting triangle
- Wave E is frequently the most awkward leg — it can undershoot its boundary, or briefly overshoot before the pattern resolves
- One leg, often C or E, may subdivide into a more complex structure than the others
- Range and volume tend to contract steadily, then expand as the pattern resolves
🐳 Pro Tip: Wave E poking through the boundary line and immediately reversing is common enough that it should not, on its own, invalidate the count. What breaks the pattern is a leg violating one of the working rules above — not a wick crossing a line you drew yourself.
🔵 5. THE THRUST — MEASURING WHAT COMES NEXT
The move out of a triangle is often called the thrust, and it is one of the few places in wave analysis offering a reasonably direct measurement.
- Take the widest part of the pattern — the vertical distance between its highest and lowest points, which in practice is usually the span of wave A
- Project that distance from the point where price left the pattern
- In a Wave 4 triangle, that projection often lands near the Wave 5 target you would already have from the Fibonacci work in Lesson 6
That last point is the one worth acting on. Two independent methods — a triangle thrust and a Fibonacci projection — pointing at the same area is a stronger read than either on its own.
The widest part of the pattern measured on the left, then the same distance projected from the point where price left the boundary. The thrust reached the general area of the projection. An area, not a precise level — overshoots and undershoots are both ordinary.
🐳 Pro Tip: A thrust that fails quickly and drops back inside the boundaries is a meaningful warning. It often means the pattern was not finished, or that the larger count needs revisiting. Falling straight back inside is not something a healthy resolution usually does.
🔵 6. TIME, AND WHY TRIANGLES TEST PATIENCE
Triangles consume time rather than price, which makes them psychologically the hardest correction to sit through.
- Range narrows, volatility drops, and the chart looks like it has stopped working
- Both breakout directions get tested repeatedly inside the pattern, so momentum entries tend to be whipsawed
- Traders who entered before the triangle began often exit somewhere in the middle of it, shortly before the resolving move
The apex — where the two boundaries would meet — is sometimes used as a loose timing reference, with resolution often arriving somewhere between 60% and 80% of the way toward it. Treat that as an expectation, not a schedule.
🐳 Pro Tip: The strongest practical use of a triangle is not the entry. It is knowing to hold. If the triangle sits in the Wave 4 position, the noise you are sitting through is the pause before the final leg — not the reversal it feels like at the time.
🔵 7. TRIANGLE OR RANGE?
Not every sideways stretch is a triangle. A quick set of checks:
- Leg count — a triangle has five, each subdividing into three. A range has whatever count price happened to produce
- Boundary discipline — the A-C and B-D lines should be reasonably clean. If it takes three attempts to draw them, they may not be there
- Position — a triangle in the Wave 4 or Wave B slot fits the framework. One in a Wave 2 slot should make you suspicious of the labels
- Contraction — range and volume should be declining through the pattern, not flat or expanding
If more than one of these fails, treating the structure as a plain range and waiting is usually a better decision than forcing a triangle label onto it.
Two sideways stretches. The left shows five contracting legs against converging boundaries; the right is a range between two horizontal levels with no reliable leg count. Only one of them supports a triangle reading — and only one of them supports a thrust projection.
🐳 Pro Tip: The cost of mislabelling a range as a triangle is not just a poor entry — it is the projection. A thrust measured from a structure that was never a triangle produces a target with nothing behind it.
🔵 8. THE SAME PAUSE IN TWO LANGUAGES
Everything above rests on labels you placed yourself. That is the honest weak point of any wave method, and it is worth describing the same stretch of chart a second time in a language that owes nothing to Elliott.
Market structure is that language. It asks one question: is the market still taking out its prior swings in the same direction?
What a triangle looks like structurally.
Read this way, a triangle is a stretch where neither side is producing structure breaks. Each leg fails to take out the extreme before it. The trend has not been contradicted — a break of structure against the prior direction never arrives — but it is not being confirmed either. That combination, no confirmation and no contradiction, is a fairly precise structural description of a pause.
The zone underneath it.
The leg that preceded the triangle was usually the fast one, and fast legs tend to leave behind areas the market departed from without trading back into them. Those areas exist on the chart the moment the acceleration happens, without any labelling. Triangles frequently form around one of them, which is part of why a Wave 4 often stalls somewhere that looks arbitrary on a count but obvious on a structural read.
One advance described twice. The count reads a five-wave sequence with a triangle in the fourth wave. Underneath, the change of character near the beginning marks the turn, each new extreme registers as a break of structure in the same direction, and the shaded area marks a zone the market accelerated away from — the region the sideways pause settled into. Note where the second break of structure falls: at the point price left the triangle, which is the thrust from Section 5 arriving under a different name. Neither reading proves the other; they arrive at the same place from different starting points.
🐳 Pro Tip: The bridge to Section 5 is direct. Structurally, the thrust is simply the first break of structure after a stretch that produced none. That break and the boundary break are usually the same event described twice — which is why a thrust that immediately fails tends to look wrong in both languages at once.
🐳 Pro Tip: Use the disagreements, not only the agreements. If the count says a triangle is still forming but structure has already broken the other way, that gap is information — and it is usually the count worth rechecking first.
🔵 COMMON MISTAKES
- Naming a triangle after three legs, before D and E have formed
- Reading ascending and descending shapes as directional signals independent of position in the sequence
- Abandoning the count when wave E briefly pierces its boundary line
- Projecting a thrust from a structure with no clean leg count
- Expecting a triangle in the Wave 2 position
- Trading inside the pattern on momentum, where whipsaws are most likely
- Reading a Wave 4 triangle as a trend reversal rather than the pause before the final leg
- Letting the wave count be the only reading on the chart, so nothing independent can disagree with it
🔵 QUICK SELF-CHECK
- Open a completed trend and find a sideways stretch inside it
- Count the legs — five, and does each subdivide into three?
- Draw the A-C and B-D boundaries and check whether they converge, diverge, or neither
- Identify which of the five types it most resembles
- Measure the widest part, project it from the breakout, and compare against what price actually did
- Check the position in the larger sequence — Wave 4, Wave B, or something that does not fit
- Describe the same stretch structurally and confirm no break occurred against the prior trend while it formed
🔵 WHAT IS NEXT
Lesson 9 — Combinations and Complex Corrections: what happens when one corrective pattern is not enough, how W-X-Y and W-X-Y-X-Z structures are built, and why the connecting X wave is where most complex counts come apart.
A quiet chart is not an empty one. The stretches where nothing appears to be happening are often where the structure is doing its most specific work — and where most of the information sits unclaimed.
Full Trading Roadmap | Wave Analysis Course
Trading Roadmap | Wave Analysis · Lesson 01 — Wave Analysis Foundations
Trading Roadmap | Wave Analysis · Lesson 02 — Impulse Waves (5-Wave Structure)
Trading Roadmap | Wave Analysis · Lesson 03 — Corrective Waves (A-B-C)
Trading Roadmap | Wave Analysis · Lesson 04 — The Rules of Elliott
Trading Roadmap | Wave Analysis · Lesson 05 — Wave Personality
Trading Roadmap | Wave Analysis · Lesson 06 — Fibonacci with Elliott
Trading Roadmap | Wave Analysis · Lesson 07 — Extended Waves
Best Regards, BigBeluga 🐳

🌐 bigbeluga.org/tv - Get access to our powerful tools & indicators.
🔵 Learn More -> docs.bigbeluga.org/
🔵 Join Discord -> go.bigbeluga.org/k65q9bfqfu
All content provided by BigBeluga is for educational purposes only
🔵 Learn More -> docs.bigbeluga.org/
🔵 Join Discord -> go.bigbeluga.org/k65q9bfqfu
All content provided by BigBeluga is for educational purposes only
פרסומים קשורים
כתב ויתור
המידע והפרסומים אינם מיועדים להיות, ואינם מהווים, ייעוץ או המלצה פיננסית, השקעתית, מסחרית או מכל סוג אחר המסופקת או מאושרת על ידי TradingView. קרא עוד ב־תנאי השימוש.
🌐 bigbeluga.org/tv - Get access to our powerful tools & indicators.
🔵 Learn More -> docs.bigbeluga.org/
🔵 Join Discord -> go.bigbeluga.org/k65q9bfqfu
All content provided by BigBeluga is for educational purposes only
🔵 Learn More -> docs.bigbeluga.org/
🔵 Join Discord -> go.bigbeluga.org/k65q9bfqfu
All content provided by BigBeluga is for educational purposes only
פרסומים קשורים
כתב ויתור
המידע והפרסומים אינם מיועדים להיות, ואינם מהווים, ייעוץ או המלצה פיננסית, השקעתית, מסחרית או מכל סוג אחר המסופקת או מאושרת על ידי TradingView. קרא עוד ב־תנאי השימוש.