
Indicators as Instruments — A Professional Framework to Choose, Calibrate, and Use Them (Without Signal-Chasing)
If you’ve been trading for a while, you already know the paradox: the more indicators you add, the less you often understand. That’s not because indicators are “bad.” It’s because most traders treat indicators as if they are oracles rather than instruments.
An indicator is not a prediction engine. It is a transformation of price/volume data into a different representation that is easier to reason about. That representation can be useful—sometimes extremely useful—but only when you understand:
- what the indicator is measuring,
- what market regime it assumes,
- what its failure modes are, and
- how you will use it as part of a decision process (not as the decision itself).
This educational idea is a “premium-level primer”: a structured way to think about indicators in a professional workflow. It is written to be broadly applicable across markets and timeframes.
----------------------------------------------------------------------
1) Start with First Principles: What an Indicator Really Is
----------------------------------------------------------------------
At its core, an indicator is a function:
Indicator = f(Price, Volume, Time)
Most popular indicators are combinations of:
- smoothing (moving averages, filters),
- differencing (momentum/ROC),
- normalization (z-score, percent changes),
- bounding (oscillators with upper/lower limits),
- volatility envelopes (bands),
- aggregation (timeframe compression, rolling windows),
- conditional logic (crosses, thresholds, states).
This matters because once you see the building blocks, you stop searching for the “perfect” indicator and start asking the right questions:
- Is this indicator mainly smoothing noise?
- Is it mainly measuring change (momentum)?
- Is it mainly measuring dispersion (volatility)?
- Is it mainly normalizing relative to recent history?
A trader who understands the transformation can anticipate where it will break.
----------------------------------------------------------------------
2) The Taxonomy: The Main Indicator Families and What They’re For
----------------------------------------------------------------------
A) Trend / Direction Indicators
Goal: Estimate direction and persistence.
Examples:
- Moving averages (SMA/EMA/WMA), MA ribbons
- ADX (trend strength, not direction)
- Trend filters (e.g., MA slope, price vs MA)
How they help:
- Reduce decision complexity (“bias”)
- Prevent fighting persistent trends
Common failure modes:
- Whipsaws in range-bound markets
- Lag during reversals
- False “trend” in volatile chop
B) Momentum / Oscillators
Goal: Measure rate of change, speed, and exhaustion.
Examples:
- RSI, Stochastic, ROC
- MACD histogram (momentum of trend)
How they help:
- Identify overextension (in ranges)
- Highlight momentum divergence (context-dependent)
Common failure modes:
- “Overbought” in strong uptrends can stay overbought for long periods
- Divergence can persist and fail (especially in trending regimes)
C) Volatility Indicators
Goal: Measure dispersion and expected movement.
Examples:
- ATR, True Range
- Bollinger Bands, Keltner Channels
- Standard deviation-based measures
How they help:
- Position sizing and stop placement
- Distinguishing “quiet trend” vs “violent chop”
- Regime detection (low vol expansion to high vol, and vice versa)
Common failure modes:
- Volatility clusters (today looks like yesterday—until it doesn’t)
- Sudden regime shifts (news/liquidity shocks)
D) Volume / Flow Indicators
Goal: Add participation and conviction context.
Examples:
- Volume MA, OBV, Volume Profile concepts (where available)
- VWAP and VWAP bands (intraday context)
- Accumulation/Distribution style tools
How they help:
- Confirm activity during breaks and retests
- Identify “thin” moves vs “supported” moves
Common failure modes:
- Volume quality varies by instrument/venue
- In some markets, volume is fragmented or not fully representative
E) Statistical / Relative Indicators
Goal: Compare to historical baseline or to another asset.
Examples:
- Z-score of returns, spread dislocation
- Relative Strength (asset vs benchmark)
- Correlation and beta-style measures
How they help:
- Pair/trend rotation analysis
- Detect unusual conditions and dislocations
Common failure modes:
- Structural repricing (baseline shifts)
- Correlation breakdowns
- Fat tails (extremes happen more than models assume)
F) Structure / Market Geometry Tools (Not Always “Indicators,” But Essential)
Goal: Describe market structure and reference points.
Examples:
- Swing highs/lows, pivots, support/resistance levels
- Trendlines/channels (manual or automated)
- Range boundaries and breaks
How they help:
- Provide context for “where” signals matter
- Prevent indicator decisions in vacuum
Common failure modes:
- Subjectivity (manual structure)
- Lag (pivot confirmation)
- Overfitting structure to the last few candles
Professional takeaway:
Indicators are most powerful when they answer different questions:
- “What is the regime?” (trend vs range, volatility)
- “What is the bias?” (trend filter)
- “What is the timing?” (momentum/structure)
- “What is the risk?” (volatility sizing)
----------------------------------------------------------------------
3) Regime is the Master Switch (Why One Indicator Can’t Win Everywhere)
----------------------------------------------------------------------
Most indicator disappointment comes from using a tool outside its native regime.
- In strong trends:
* Trend filters shine.
* Oscillators can mislead if used as reversal triggers.
- In ranges:
* Oscillators shine.
* Trend-following crosses whipsaw.
- In high volatility:
* Volatility-based sizing becomes more important than “entries.”
* Many signals increase in frequency and decrease in quality.
- In low volatility:
* Breakouts can be cleaner, but false breaks still happen.
* Risk of “overconfidence” rises.
A professional approach begins with regime detection:
- Are we trending or ranging?
- Is volatility expanding or contracting?
- Is the market liquid and orderly, or jumpy and thin?
You don’t need a complex regime model. Even a simple pair of questions can improve decisions:
- Is price above/below a higher-timeframe moving average?
- Is ATR rising or falling relative to its recent average?
----------------------------------------------------------------------
4) The “Redundancy Trap”: Why More Indicators Often Add Less Information
----------------------------------------------------------------------
Many traders unknowingly stack correlated indicators:
- RSI + Stochastic + MACD histogram are often three views of momentum.
- Multiple moving averages are often one idea repeated with different lag.
This creates “confirmation illusion”: you think three tools agree, but they are measuring the same thing.
A clean professional dashboard usually has:
- One regime tool (trend/range, volatility state)
- One bias tool (trend filter)
- One timing tool (momentum or structure)
- One risk tool (volatility sizing)
Optionally:
- One context tool (volume/flow or relative strength)
The goal is orthogonality: each tool should contribute a distinct piece of information.
----------------------------------------------------------------------
5) Calibration: Parameters Are Not “Settings,” They Are Assumptions
----------------------------------------------------------------------
Changing a parameter changes what you are measuring.
Example: RSI length
- Short length (e.g., 7–10): sensitive, fast, noisy, frequent signals.
- Standard-ish length (e.g., 14): balanced, common baseline.
- Long length (e.g., 21–28+): slower, fewer signals, more stable.
Example: Moving average length
- Short MA: closer to price, reactive, whipsaws more.
- Long MA: smoother, fewer flips, more lag.
Example: Bollinger Bands
- Lookback length and standard deviation multiplier define “what is unusual.”
Professional calibration workflow:
1) Pick the decision you want to improve (bias, timing, risk).
2) Choose a timeframe where you can actually execute.
3) Start with default baselines (common lengths), not “optimized.”
4) Validate across different market phases (trend, range, high vol).
5) Prefer stability over perfection: a robust parameter beats a fragile optimized one.
Avoid overfitting:
- If a setting only works in the last 2–3 months, it’s probably curve-fitted.
- If small parameter changes destroy performance, it’s fragile.
----------------------------------------------------------------------
6) How to Use Indicators in a Process (Not as a Binary “Buy/Sell” Button)
----------------------------------------------------------------------
A professional indicator workflow usually looks like a checklist:
Step 1 — Context / Regime
- Trend or range?
- Volatility expanding or contracting?
- Any obvious market structure levels nearby?
Step 2 — Bias
- If trending: bias with higher-timeframe filter (price vs MA, or structure).
- If ranging: bias is neutral until boundary tests occur.
Step 3 — Setup
- Identify a location where a decision makes sense:
* pullback to structure,
* breakout of range,
* retest of key level,
* mean reversion extreme (only if regime supports it).
Step 4 — Timing (Trigger)
- Use one trigger style consistently:
* candle close confirmation,
* momentum cross,
* structure break + retest,
* volatility contraction → expansion.
Step 5 — Risk
- Use volatility to define invalidation distance (ATR-based logic is common).
- Define max risk per idea and position size accordingly.
Step 6 — Review
- Record what the indicator said and what the market did.
- If you can’t explain your trade in one paragraph, your system is too complex.
Indicators are best used as “if-then” constraints:
- If regime = trend, then oscillators are timing tools, not reversal tools.
- If volatility is high, then reduce leverage/size and widen invalidations.
- If volume is weak during a breakout, then treat it with caution.
----------------------------------------------------------------------
7) Practical Examples (Conceptual, Not Trade Advice)
----------------------------------------------------------------------
Example A: ATR as the “Risk Engine”
- Use ATR to estimate typical movement.
- Invalidation distance = k * ATR (k depends on timeframe/instrument behavior).
- Position size = (max risk) / (invalidation distance).
This turns volatility from “scary noise” into a measurable input.
Example B: Moving Average as a Bias Filter
- Price above a higher-timeframe MA = bullish bias.
- Price below = bearish bias.
- Execution decisions still happen at structure levels (pullbacks/retests).
The MA is not your entry. It’s your “bias gate.”
Example C: RSI as Range Timing (When Regime Supports It)
- In a stable range, RSI extremes can align with range boundaries.
- In a trend, RSI extremes often appear early and persist.
RSI is not wrong. The regime assumption is wrong.
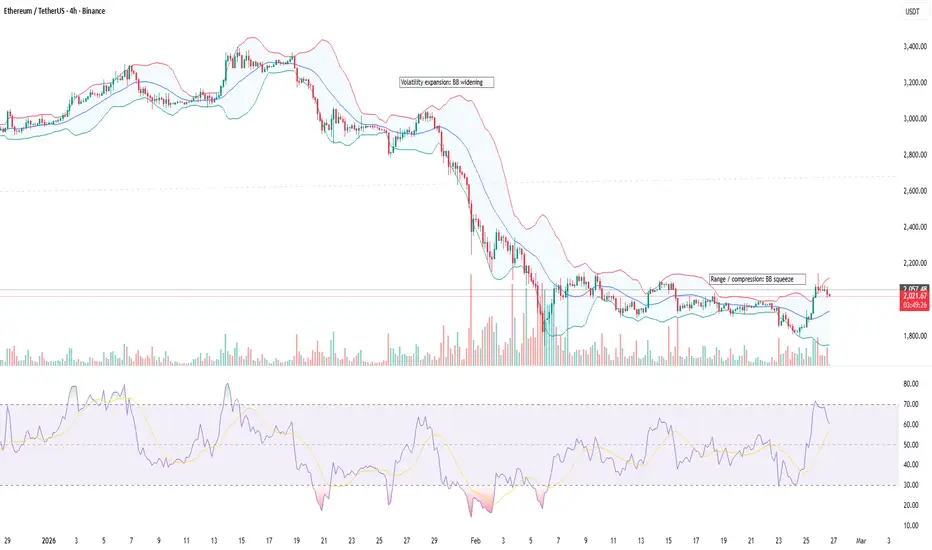
Example D: Bollinger Bands as Volatility Context
- Band squeeze can suggest low volatility.
- Expansion can suggest a transition to higher volatility.
But direction is not guaranteed; structure and confirmation still matter.
----------------------------------------------------------------------
8) Failure Modes You Must Respect (The “Professional Humility” Section)
----------------------------------------------------------------------
Indicators fail predictably:
- During regime shifts (trend ↔ range, vol shocks)
- During low-liquidity periods (gaps, thin order books)
- During narrative repricing (structural shifts)
- When used as a standalone signal (no context)
- When traders change rules mid-trade (“indicator shopping”)
A disciplined trader assumes the indicator will fail sometimes and designs risk so failure is survivable.
----------------------------------------------------------------------
9) How to Publish Educational Ideas That Don’t Look Like Spam
----------------------------------------------------------------------
If you share educational indicator content publicly:
- Provide chart annotations that match the text (clean, readable).
- Use clear headings and structured sections.
- Avoid hype, certainty language, or performance claims.
- Explain limitations and when the tool should not be used.
- Keep tags relevant; don’t stuff keywords.
The goal is to teach a reusable framework, not to advertise anything.
----------------------------------------------------------------------
10) Bottom Line: A Minimalist “Professional Indicator Stack”
----------------------------------------------------------------------
If you want a clean baseline stack, start here:
1) Regime: ATR state or volatility envelope + basic trend/range read
2) Bias: higher-timeframe trend filter (MA/structure)
3) Timing: one oscillator OR one structure trigger (not five)
4) Risk: ATR-based sizing/invalidation logic
Optional:
5) Context: volume/flow or relative strength vs benchmark
Then iterate slowly. The best indicator system is the one you can follow when you’re tired, stressed, or wrong.
Risk disclosure:
This is educational content only and not financial advice. Indicators do not guarantee outcomes. Markets can remain irrational longer than any indicator remains comfortable. Always use independent judgment and risk management.

Trading Suite | Flagship Workflow :
tradingview.com/script/XJmX3p98-Trading-Suite-AGPro-Series/
Crypto Setup Planner | Multi-Symbol Analysis :
tradingview.com/script/LgVRo7Ql-Crypto-Setup-Planner-AGPro-Series/
tradingview.com/script/XJmX3p98-Trading-Suite-AGPro-Series/
Crypto Setup Planner | Multi-Symbol Analysis :
tradingview.com/script/LgVRo7Ql-Crypto-Setup-Planner-AGPro-Series/
כתב ויתור
המידע והפרסומים אינם מיועדים להיות, ואינם מהווים, ייעוץ או המלצה פיננסית, השקעתית, מסחרית או מכל סוג אחר המסופקת או מאושרת על ידי TradingView. קרא עוד ב־תנאי השימוש.