

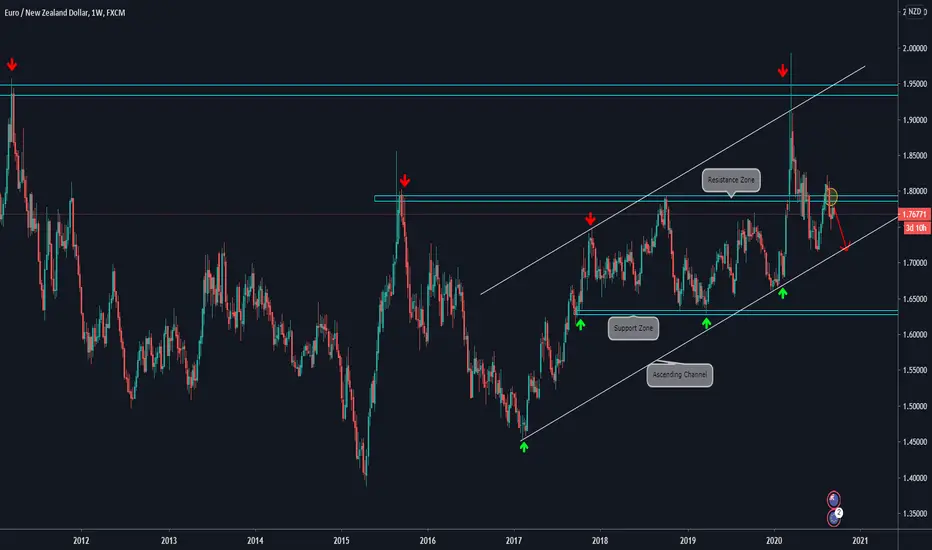
🔸WEEKLY CHART EXPLANATION:
.
.
🔸Price bounced at the Confluence Zone between the Ascending Channel and the Resistance Zone.
.
🔸It did a strong downside move breaking the Support Zone (now Resistance Zone).
.
🔸It has retested the zone again and we observe that was a strong rejection there. We consider that it has potential to reach the Ascending Trendline
.
🔸 Will look for a lower timeframe bearish setup.
🔸 DAILY CHART ANALYSIS:

.
.
🔸Price bounced at the Confluence Zone between the Ascending Channel and the Resistance Zone.
.
🔸It did a strong downside move breaking the Support Zone (now Resistance Zone).
.
🔸It has retested the zone again and we observe that was a strong rejection there. We consider that it has potential to reach the Ascending Trendline
.
🔸 Will look for a lower timeframe bearish setup.
🔸 DAILY CHART ANALYSIS:

כתב ויתור
המידע והפרסומים אינם מיועדים להיות, ואינם מהווים, ייעוץ או המלצה פיננסית, השקעתית, מסחרית או מכל סוג אחר המסופקת או מאושרת על ידי TradingView. קרא עוד ב־תנאי השימוש.
כתב ויתור
המידע והפרסומים אינם מיועדים להיות, ואינם מהווים, ייעוץ או המלצה פיננסית, השקעתית, מסחרית או מכל סוג אחר המסופקת או מאושרת על ידי TradingView. קרא עוד ב־תנאי השימוש.