

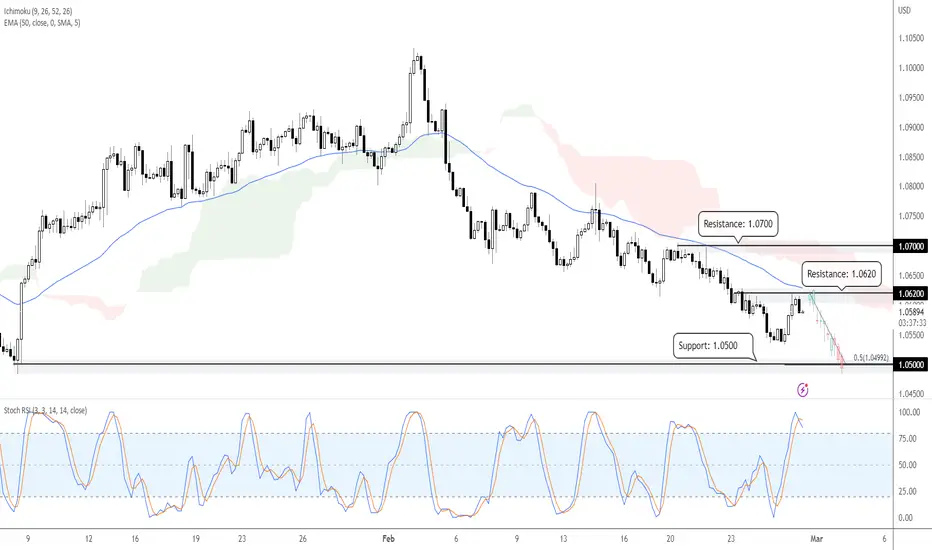
On the H4 timeframe, prices are showing bearish order flow with lower lows and lower highs formed. A pullback to the resistance zone at 1.0620 could present an opportunity to play the drop to the next support zone at 1.0500, in line with the graphical low and 50% Fibonacci extension. Prices are holding below the Ichimoku cloud and 50 EMA, while Stochastic RSI is in the overbought region above 80, supporting our bearish bias.

כתב ויתור
המידע והפרסומים אינם מיועדים להיות, ואינם מהווים, ייעוץ או המלצה פיננסית, השקעתית, מסחרית או מכל סוג אחר המסופקת או מאושרת על ידי TradingView. קרא עוד ב־תנאי השימוש.
כתב ויתור
המידע והפרסומים אינם מיועדים להיות, ואינם מהווים, ייעוץ או המלצה פיננסית, השקעתית, מסחרית או מכל סוג אחר המסופקת או מאושרת על ידי TradingView. קרא עוד ב־תנאי השימוש.