

Hey Traders,
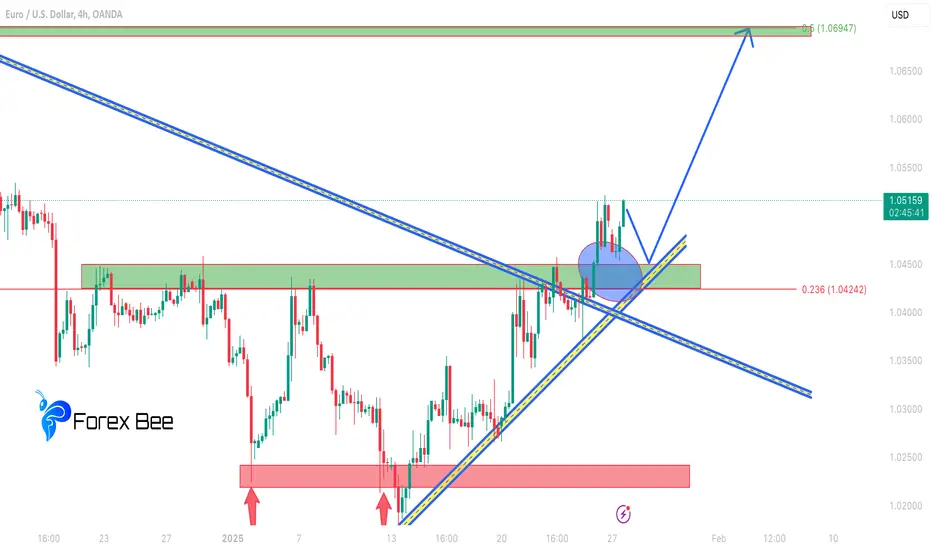
This EUR/USD H4 chart suggests a bullish scenario, with price action breaking key levels and retesting them for continuation. Here's the technical analysis:
### Observations:
1. Trend Analysis:
- The price has broken above the descending trendline, signaling a shift from a bearish to a bullish bias.
- The breakout has been followed by a successful retest within the green zone, confirming it as a support level.
2. Key Levels:
- Support: The green zone around 1.0480-1.0500 has acted as a strong support after the breakout.
- Resistance: The chart highlights a target near the 0.5 Fibonacci level at 1.0694.
3. Retest Zone:
- The blue highlighted area indicates a retest of the broken trendline and horizontal support. This confluence area strengthens the bullish case.
4. Fibonacci Levels:
- The 0.236 Fibonacci level (~1.0424) was successfully held, suggesting that the retracement is over and the upward momentum may resume.
5. Potential Movement**:
- The price is expected to continue its bullish movement, as indicated by the blue arrows, with a primary target around 1.0694.
---
### My Thoughts:
This chart looks bullish, with a strong base formed around 1.0480-1.0500. Watching for further confirmation through price action, such as higher highs and higher lows, would be wise. However, a break below the retest area could invalidate this setup and shift the bias.
This EUR/USD H4 chart suggests a bullish scenario, with price action breaking key levels and retesting them for continuation. Here's the technical analysis:
### Observations:
1. Trend Analysis:
- The price has broken above the descending trendline, signaling a shift from a bearish to a bullish bias.
- The breakout has been followed by a successful retest within the green zone, confirming it as a support level.
2. Key Levels:
- Support: The green zone around 1.0480-1.0500 has acted as a strong support after the breakout.
- Resistance: The chart highlights a target near the 0.5 Fibonacci level at 1.0694.
3. Retest Zone:
- The blue highlighted area indicates a retest of the broken trendline and horizontal support. This confluence area strengthens the bullish case.
4. Fibonacci Levels:
- The 0.236 Fibonacci level (~1.0424) was successfully held, suggesting that the retracement is over and the upward momentum may resume.
5. Potential Movement**:
- The price is expected to continue its bullish movement, as indicated by the blue arrows, with a primary target around 1.0694.
---
### My Thoughts:
This chart looks bullish, with a strong base formed around 1.0480-1.0500. Watching for further confirmation through price action, such as higher highs and higher lows, would be wise. However, a break below the retest area could invalidate this setup and shift the bias.
עסקה פעילה

כתב ויתור
המידע והפרסומים אינם מיועדים להיות, ואינם מהווים, ייעוץ או המלצה פיננסית, השקעתית, מסחרית או מכל סוג אחר המסופקת או מאושרת על ידי TradingView. קרא עוד ב־תנאי השימוש.
כתב ויתור
המידע והפרסומים אינם מיועדים להיות, ואינם מהווים, ייעוץ או המלצה פיננסית, השקעתית, מסחרית או מכל סוג אחר המסופקת או מאושרת על ידי TradingView. קרא עוד ב־תנאי השימוש.