

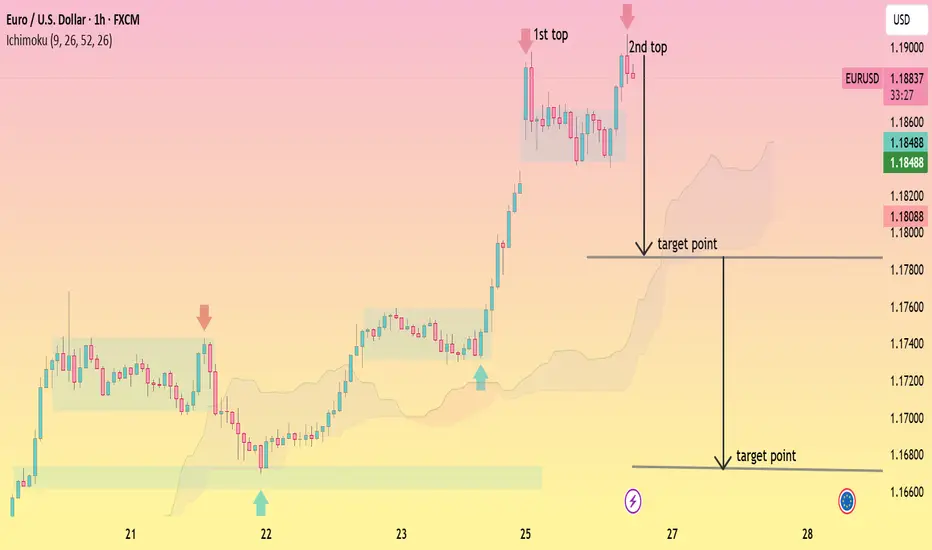
EURUSD, (1H chart pattern).
Clear double top (“1st top” and “2nd top”) around 1.1900
Price is extended above the Ichimoku cloud → pullback / correction likely
Me’ve already marked downside target zones, which makes sense
Logical downside targets
Based on structure + support levels:
🎯 Target 1 (conservative)
≈ 1.1800
Prior consolidation area
Psychological round number
Likely first reaction / partial profit zone
🎯 Target 2 (main target)
≈ 1.1680 – 1.1700
Strong previous support
Near cloud base / value area
Matches measured pullback after impulsive move
In short
TP1: 1.1800
TP2: 1.1680–1.1700
If price breaks and holds above 1.1900, the double-top idea is invalid and bearish targets are off.
If my want, I can also:
Suggest stop-loss placement
Do a risk-reward breakdown
Or map bullish targets if it breaks higher 📈
Clear double top (“1st top” and “2nd top”) around 1.1900
Price is extended above the Ichimoku cloud → pullback / correction likely
Me’ve already marked downside target zones, which makes sense
Logical downside targets
Based on structure + support levels:
🎯 Target 1 (conservative)
≈ 1.1800
Prior consolidation area
Psychological round number
Likely first reaction / partial profit zone
🎯 Target 2 (main target)
≈ 1.1680 – 1.1700
Strong previous support
Near cloud base / value area
Matches measured pullback after impulsive move
In short
TP1: 1.1800
TP2: 1.1680–1.1700
If price breaks and holds above 1.1900, the double-top idea is invalid and bearish targets are off.
If my want, I can also:
Suggest stop-loss placement
Do a risk-reward breakdown
Or map bullish targets if it breaks higher 📈
עסקה פעילה
active active 
פרסומים קשורים
כתב ויתור
המידע והפרסומים אינם מיועדים להיות, ואינם מהווים, ייעוץ או המלצה פיננסית, השקעתית, מסחרית או מכל סוג אחר המסופקת או מאושרת על ידי TradingView. קרא עוד ב־תנאי השימוש.
פרסומים קשורים
כתב ויתור
המידע והפרסומים אינם מיועדים להיות, ואינם מהווים, ייעוץ או המלצה פיננסית, השקעתית, מסחרית או מכל סוג אחר המסופקת או מאושרת על ידי TradingView. קרא עוד ב־תנאי השימוש.