

Hello, traders!
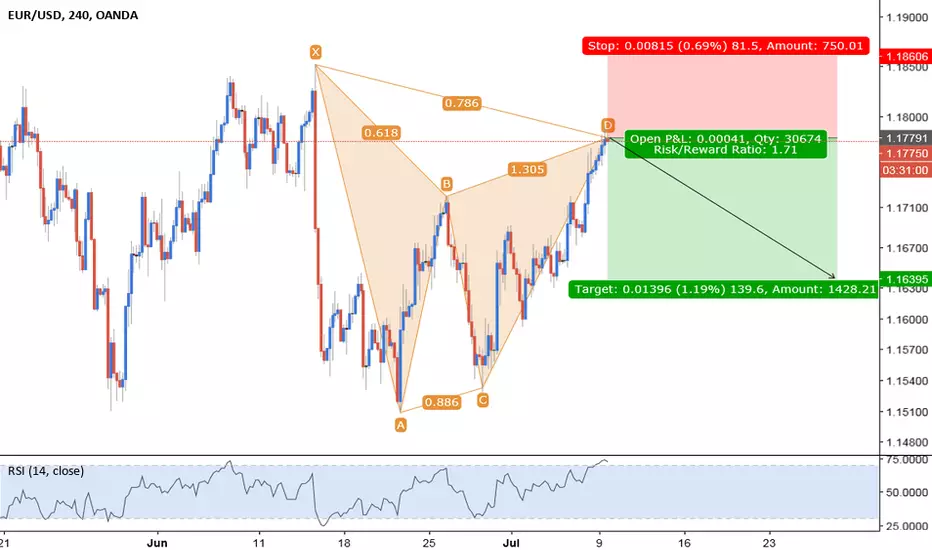
Today, we are looking at a Bearish Gartley Pattern on the 4H chart with EUR/USD.
Price seems to be stalling out with the RSI confirming price has been over bought.
Let me know what you all think!
The measurements for a valid Gartley Pattern are detailed below:
B: 0.618
C: 0.382 - 0.886
D: 1.272 - 1.618
Final X to D: 0.786
Today, we are looking at a Bearish Gartley Pattern on the 4H chart with EUR/USD.
Price seems to be stalling out with the RSI confirming price has been over bought.
Let me know what you all think!
The measurements for a valid Gartley Pattern are detailed below:
B: 0.618
C: 0.382 - 0.886
D: 1.272 - 1.618
Final X to D: 0.786

כתב ויתור
המידע והפרסומים אינם מיועדים להיות, ואינם מהווים, ייעוץ או המלצה פיננסית, השקעתית, מסחרית או מכל סוג אחר המסופקת או מאושרת על ידי TradingView. קרא עוד ב־תנאי השימוש.
כתב ויתור
המידע והפרסומים אינם מיועדים להיות, ואינם מהווים, ייעוץ או המלצה פיננסית, השקעתית, מסחרית או מכל סוג אחר המסופקת או מאושרת על ידי TradingView. קרא עוד ב־תנאי השימוש.