

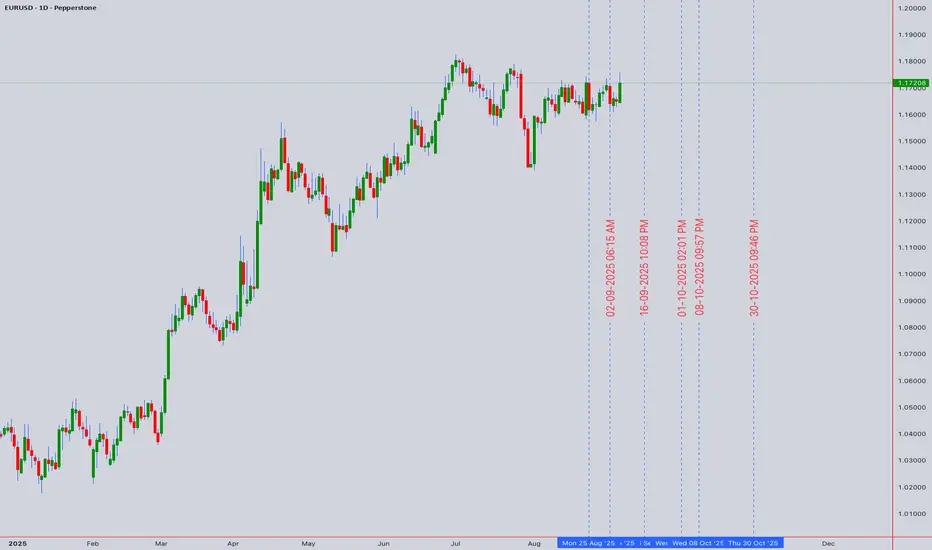
📊 EURUSD Technical Analysis & Trading Strategy | Week of Sept 6th, 2025
Asset: EURUSD CFD | Spot Price: 1.17208 (as of Sept 6th, 2025, 12:54 AM UTC+4) | Timeframe: Intraday & Swing
🎯 Executive Summary (TL;DR)
EURUSD is at a critical 🔄 juncture! Our multi-indicator analysis reveals a market in consolidation following a recent bearish impulse. Key 🎯 harmonic and Gann-based support converges near 1.16800. A break below could trigger a sell-off towards 1.1600, while a hold could spark a bullish correction towards 1.1800. This week is pivotal for direction! ⚔️
📈 Detailed Technical Breakdown
1. Chart Pattern & Theory Analysis
📉 Elliott Wave Theory: The price action from the August high suggests we are in a corrective wave (likely Wave 4 or a bearish Wave C). The structure is complex, indicating potential exhaustion of the current move.
🦀 Harmonic Patterns: A potential Bullish Bat Pattern 🦇 is completing near the 1.1680-1.1700 zone. This is a key PRZ (Potential Reversal Zone) with a high probability of a bullish reversal.
🧮 W.D. Gann Analysis: Applying the Square of 9 and Gann angles, the price is testing a vital support angle. A daily close below 1.1700 would be a strong bearish signal according to Gann time-price theory, opening the path downward.
⛰️ Head and Shoulders: A smaller, intraday Head and Shoulders pattern is forming on the 4H chart. A break below the neckline (approx. 1.1700) would confirm this bearish reversal pattern, projecting a target towards 1.1650.
⚖️ Wyckoff Theory: The chart shows signs of a re-distribution phase. We are watching for a Sign of Weakness (SOW) or a Spring (a false breakdown below support) that could indicate the next major move.
2. Key Support & Resistance Levels
🧱 Immediate Resistance: 1.17500 (Previous Support turned Resistance)
🎯 Strong Resistance: 1.18000 (Psychological Level & 50-Day EMA)
🛡️ Immediate Support: 1.17000 (Psychological & Pattern Confluence)
🎯 Strong Support: 1.16800 (Harmonic & Gann Confluence Zone)
🚨 Major Support: 1.16000 (Weekly Swing Low)
3. Indicator & Momentum Outlook
📶 RSI (14): Currently reading 42 on the 4H chart. This indicates a neutral-to-bearish bias with room to move lower before hitting oversold territory (<30).
📊 Bollinger Bands (20): Price is trading in the lower half of the bands, indicating bearish pressure. A squeeze is evident, suggesting a volatility expansion is imminent. A move towards the middle band (20-SMA) is likely on any bounce.
💹 Moving Averages: The 50-EMA (1.1790) and 200-EMA (1.1755) are both above the current price, confirming the short-term bearish trend. A ** bearish cross** (50-EMA crossing below 200-EMA) is not yet in play but is being watched closely.
🏢 VWAP (Volume Weighted Average Price): The price is trading below the daily VWAP, indicating that buyers from this period are at a loss—a bearish sentiment. The Anchored VWAP from the last high shows significant selling pressure.
⏰ Trading Strategy & Forecast
A) Intraday Trading (5M - 1H Charts) 🎯
🔻 Bearish Scenario (Breakdown): A break and close below 1.17000 could signal a short opportunity. Target: 1.16800 (initial), then 1.16500. Stop Loss: just above 1.17250.
🔺 Bullish Scenario (Bounce): A hold above 1.17000 with a bullish reversal candlestick (e.g., Hammer, Engulfing) could signal a long scalp. Target: 1.17500 (resistance). Stop Loss: below 1.16850.
B) Swing Trading (4H - Daily Charts) 📅
🔄 Outlook: The swing bias remains cautiously bearish until price reclaims the 1.1800 level.
Entry (Short): A retest of 1.1750-1.1780 (failed resistance) could offer a high-probability short entry for a swing down towards 1.1600.
Entry (Long): Aggressive bulls could look for long entries near 1.1680 (harmonic/Gann support) with a tight stop below 1.1660, targeting a move back to 1.1800.
🧘 Risk Management: Always use a stop-loss. Risk no more than 1-2% of your account on any single trade.
🌍 Market Context & Final Thoughts
Globally, all eyes are on ECB vs. Fed policy divergence 🏦. Any hawkish remarks from the Fed or dovish tones from the ECB could fuel further USD strength, pressuring EURUSD lower. This technical setup aligns with a bearish fundamental backdrop.
Conclusion: The 1.1680-1.1700 zone is absolutely critical. 🚨 A break below likely triggers the next leg down. A strong bounce from here could lead to a larger corrective rally. Trade the breakout/breakdown with the confluence of patterns and indicators.
✅ Trade Safe! Remember to always manage your risk.
Asset: EURUSD CFD | Spot Price: 1.17208 (as of Sept 6th, 2025, 12:54 AM UTC+4) | Timeframe: Intraday & Swing
🎯 Executive Summary (TL;DR)
EURUSD is at a critical 🔄 juncture! Our multi-indicator analysis reveals a market in consolidation following a recent bearish impulse. Key 🎯 harmonic and Gann-based support converges near 1.16800. A break below could trigger a sell-off towards 1.1600, while a hold could spark a bullish correction towards 1.1800. This week is pivotal for direction! ⚔️
📈 Detailed Technical Breakdown
1. Chart Pattern & Theory Analysis
📉 Elliott Wave Theory: The price action from the August high suggests we are in a corrective wave (likely Wave 4 or a bearish Wave C). The structure is complex, indicating potential exhaustion of the current move.
🦀 Harmonic Patterns: A potential Bullish Bat Pattern 🦇 is completing near the 1.1680-1.1700 zone. This is a key PRZ (Potential Reversal Zone) with a high probability of a bullish reversal.
🧮 W.D. Gann Analysis: Applying the Square of 9 and Gann angles, the price is testing a vital support angle. A daily close below 1.1700 would be a strong bearish signal according to Gann time-price theory, opening the path downward.
⛰️ Head and Shoulders: A smaller, intraday Head and Shoulders pattern is forming on the 4H chart. A break below the neckline (approx. 1.1700) would confirm this bearish reversal pattern, projecting a target towards 1.1650.
⚖️ Wyckoff Theory: The chart shows signs of a re-distribution phase. We are watching for a Sign of Weakness (SOW) or a Spring (a false breakdown below support) that could indicate the next major move.
2. Key Support & Resistance Levels
🧱 Immediate Resistance: 1.17500 (Previous Support turned Resistance)
🎯 Strong Resistance: 1.18000 (Psychological Level & 50-Day EMA)
🛡️ Immediate Support: 1.17000 (Psychological & Pattern Confluence)
🎯 Strong Support: 1.16800 (Harmonic & Gann Confluence Zone)
🚨 Major Support: 1.16000 (Weekly Swing Low)
3. Indicator & Momentum Outlook
📶 RSI (14): Currently reading 42 on the 4H chart. This indicates a neutral-to-bearish bias with room to move lower before hitting oversold territory (<30).
📊 Bollinger Bands (20): Price is trading in the lower half of the bands, indicating bearish pressure. A squeeze is evident, suggesting a volatility expansion is imminent. A move towards the middle band (20-SMA) is likely on any bounce.
💹 Moving Averages: The 50-EMA (1.1790) and 200-EMA (1.1755) are both above the current price, confirming the short-term bearish trend. A ** bearish cross** (50-EMA crossing below 200-EMA) is not yet in play but is being watched closely.
🏢 VWAP (Volume Weighted Average Price): The price is trading below the daily VWAP, indicating that buyers from this period are at a loss—a bearish sentiment. The Anchored VWAP from the last high shows significant selling pressure.
⏰ Trading Strategy & Forecast
A) Intraday Trading (5M - 1H Charts) 🎯
🔻 Bearish Scenario (Breakdown): A break and close below 1.17000 could signal a short opportunity. Target: 1.16800 (initial), then 1.16500. Stop Loss: just above 1.17250.
🔺 Bullish Scenario (Bounce): A hold above 1.17000 with a bullish reversal candlestick (e.g., Hammer, Engulfing) could signal a long scalp. Target: 1.17500 (resistance). Stop Loss: below 1.16850.
B) Swing Trading (4H - Daily Charts) 📅
🔄 Outlook: The swing bias remains cautiously bearish until price reclaims the 1.1800 level.
Entry (Short): A retest of 1.1750-1.1780 (failed resistance) could offer a high-probability short entry for a swing down towards 1.1600.
Entry (Long): Aggressive bulls could look for long entries near 1.1680 (harmonic/Gann support) with a tight stop below 1.1660, targeting a move back to 1.1800.
🧘 Risk Management: Always use a stop-loss. Risk no more than 1-2% of your account on any single trade.
🌍 Market Context & Final Thoughts
Globally, all eyes are on ECB vs. Fed policy divergence 🏦. Any hawkish remarks from the Fed or dovish tones from the ECB could fuel further USD strength, pressuring EURUSD lower. This technical setup aligns with a bearish fundamental backdrop.
Conclusion: The 1.1680-1.1700 zone is absolutely critical. 🚨 A break below likely triggers the next leg down. A strong bounce from here could lead to a larger corrective rally. Trade the breakout/breakdown with the confluence of patterns and indicators.
✅ Trade Safe! Remember to always manage your risk.

I am nothing @shunya.trade
כתב ויתור
המידע והפרסומים אינם מיועדים להיות, ואינם מהווים, ייעוץ או המלצה פיננסית, השקעתית, מסחרית או מכל סוג אחר המסופקת או מאושרת על ידי TradingView. קרא עוד ב־תנאי השימוש.
I am nothing @shunya.trade
כתב ויתור
המידע והפרסומים אינם מיועדים להיות, ואינם מהווים, ייעוץ או המלצה פיננסית, השקעתית, מסחרית או מכל סוג אחר המסופקת או מאושרת על ידי TradingView. קרא עוד ב־תנאי השימוש.