 FFL
📉 Discount Zone Approaching: Is This the Next High-Probability Reversal Setup? 🇵🇰📈
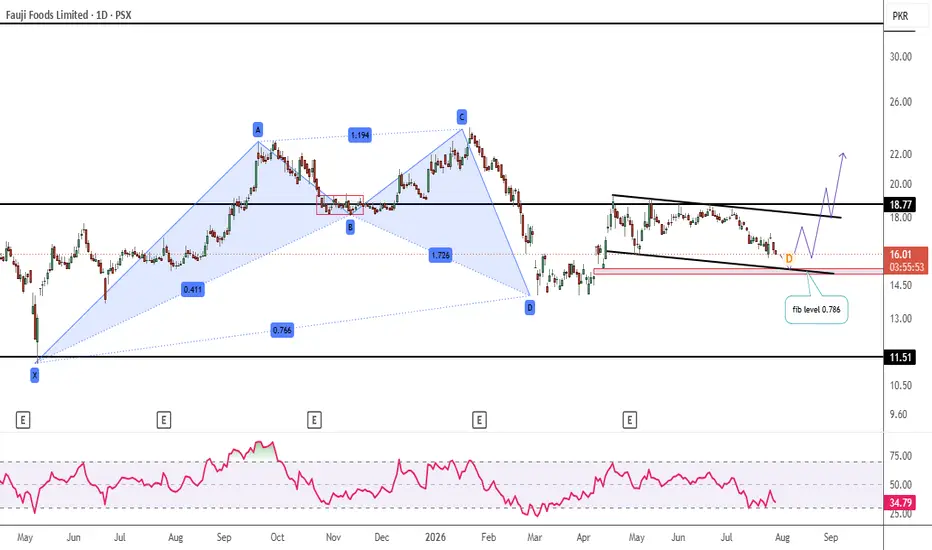
The stock is gradually moving toward the 0.786 Fibonacci retracement level—a zone that has historically acted as a high-conviction demand area.
From a price action perspective, this is a level worth watching closely rather than chasing the current move.
🔍 Why the 0.786 Fibonacci Level Matters
Looking at the stock's previous major correction, price respected the 0.786 Fibonacci retracement almost perfectly.
Following that reaction:
✅ Price consolidated for nearly a month.
✅ Buyers gradually regained control.
✅ The stock delivered an impressive ~30% rally in a relatively short period.
While history doesn't guarantee repetition, it highlights the importance of this technical zone.
🎯 Potential Reversal Zone
The next key demand area lies around:
📍 15.20–15.00
If price enters this region and begins to show bullish price action, increasing volume, or a confirmed reversal pattern, it could offer an attractive risk-to-reward opportunity.
🚀 Potential Upside Targets
A successful rebound from the demand zone could initially target:
🎯 17.50 – First resistance and short-term objective.
🎯 18.00 – Previous supply zone.
🎯 18.80 – Major technical resistance.
📈 Bullish Confirmation
The most important breakout level remains:
📌 19.00
A sustained close above 19.00, supported by strong volume and continued buying momentum, would strengthen the bullish outlook and could pave the way for an extended rally toward 21–22.
📊 My View
The stock is approaching one of the most interesting technical zones on the chart.
Rather than anticipating a reversal, I prefer to wait for confirmation through bullish candlestick patterns, improving momentum, or a Higher Low before considering fresh positions.
If the 15.20–15.00 demand zone holds, it could become a compelling accumulation area for swing traders.
Do you think the 0.786 Fibonacci level will once again attract buyers, or will the market need a deeper correction before the next rally? Share your analysis below! 👇
⚠️ Financial Disclaimer
Disclaimer: This analysis is shared for educational and informational purposes only and should not be considered financial or investment advice. Always conduct your own research and apply appropriate risk management before making investment decisions.
#PSX #PakistanStockExchange #PakistanStocks #KSE100 #PSXTrading #PakistanInvesting #PakistanEquities #PSXInvestors #KarachiStockExchange #ValueInvesting
#TechnicalAnalysis #TradingView #PriceAction #MarketStructure #Fibonacci #FibonacciRetracement #DemandZone #SupportAndResistance #SwingTrading #Breakout #BullishReversal #ChartPatterns #TrendFollowing #MomentumTrading #TradingIdeas #ChartAnalysis #StockAnalysis #RiskManagement #Investing #StockMarket #WiSHFundManagement

כתב ויתור
המידע והפרסומים אינם מיועדים להיות, ואינם מהווים, ייעוץ או המלצה פיננסית, השקעתית, מסחרית או מכל סוג אחר המסופקת או מאושרת על ידי TradingView. קרא עוד ב־תנאי השימוש.
כתב ויתור
המידע והפרסומים אינם מיועדים להיות, ואינם מהווים, ייעוץ או המלצה פיננסית, השקעתית, מסחרית או מכל סוג אחר המסופקת או מאושרת על ידי TradingView. קרא עוד ב־תנאי השימוש.