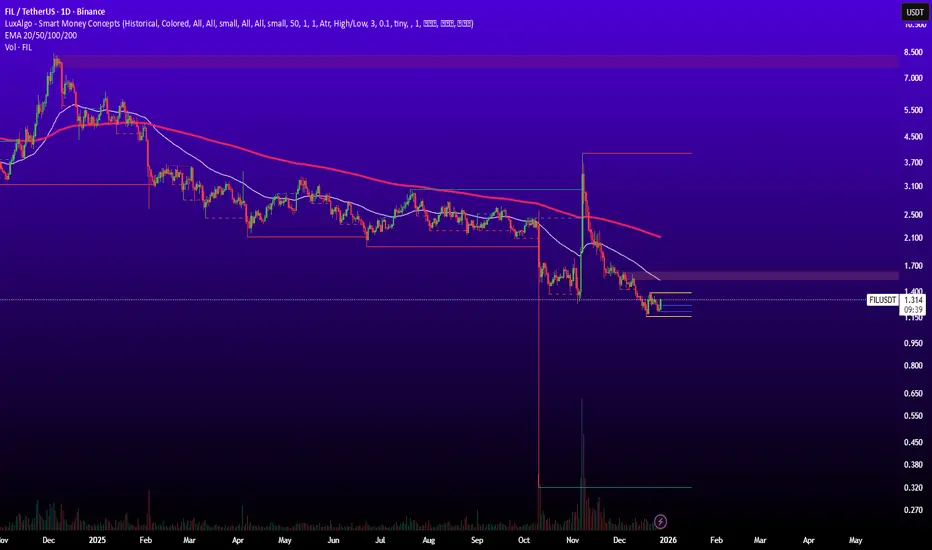
The daily chart of 
 FILUSDT shows an overall bearish structure, but weakening selling pressure and price consolidation suggest that downside momentum is fading at current levels.
Price is moving inside a lower-range trading zone, and a breakout above the range high could be the first sign of a bearish trend correction.
FILUSDT shows an overall bearish structure, but weakening selling pressure and price consolidation suggest that downside momentum is fading at current levels.Price is moving inside a lower-range trading zone, and a breakout above the range high could be the first sign of a bearish trend correction.
- Supports:
- 1.150
- Resistances:
- 1.311
- 1.600 to 1.700
- 2.100
- 2.500

פרסומים קשורים
כתב ויתור
המידע והפרסומים אינם מיועדים להיות, ואינם מהווים, ייעוץ או המלצה פיננסית, השקעתית, מסחרית או מכל סוג אחר המסופקת או מאושרת על ידי TradingView. קרא עוד ב־תנאי השימוש.
כתב ויתור
המידע והפרסומים אינם מיועדים להיות, ואינם מהווים, ייעוץ או המלצה פיננסית, השקעתית, מסחרית או מכל סוג אחר המסופקת או מאושרת על ידי TradingView. קרא עוד ב־תנאי השימוש.