לונג
FTM ANALYSIS
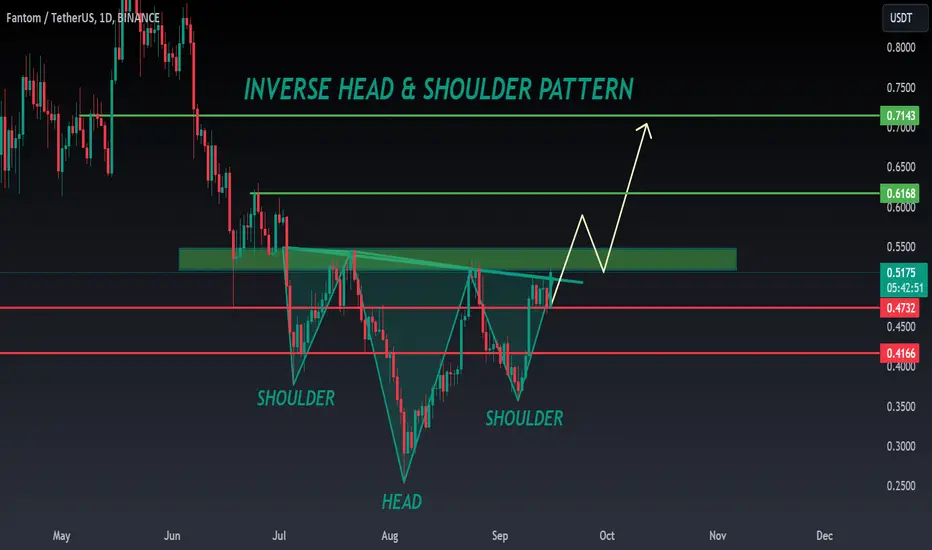
🚀#FTM Analysis : Pattern Formation
🔮As we can see in the chart of #FTM that there is a formation Inverse Head And Shoulder Pattern and it's a bullish pattern. If the candle closes above the neckline then a bullish move could be confirmed✅️
🔰Current Price: $0.5160
🎯 Target Price: $0.7140
⚡️What to do ?
👀Keep an eye on #FTM price action. We can trade according to the chart and make some profits⚡️⚡️
#FTM #Cryptocurrency #TechnicalAnalysis #DYOR
🔮As we can see in the chart of #FTM that there is a formation Inverse Head And Shoulder Pattern and it's a bullish pattern. If the candle closes above the neckline then a bullish move could be confirmed✅️
🔰Current Price: $0.5160
🎯 Target Price: $0.7140
⚡️What to do ?
👀Keep an eye on #FTM price action. We can trade according to the chart and make some profits⚡️⚡️
#FTM #Cryptocurrency #TechnicalAnalysis #DYOR

פרסומים קשורים
כתב ויתור
המידע והפרסומים אינם מיועדים להיות, ואינם מהווים, ייעוץ או המלצה פיננסית, השקעתית, מסחרית או מכל סוג אחר המסופקת או מאושרת על ידי TradingView. קרא עוד ב־תנאי השימוש.
כתב ויתור
המידע והפרסומים אינם מיועדים להיות, ואינם מהווים, ייעוץ או המלצה פיננסית, השקעתית, מסחרית או מכל סוג אחר המסופקת או מאושרת על ידי TradingView. קרא עוד ב־תנאי השימוש.