
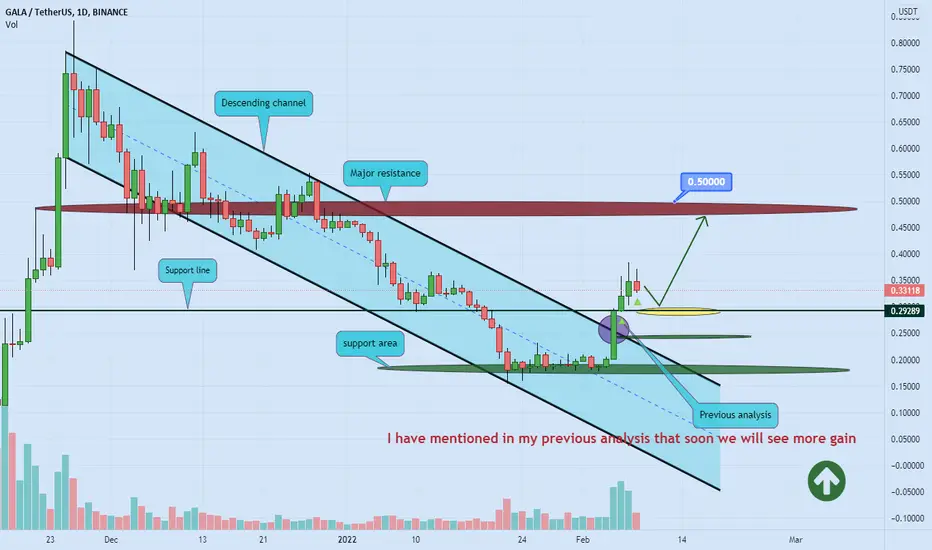
Based on the chart, the price breaks the descending channel to the upside and here brief correction to the downside based on the Fibonacci levels expected ✔️
and
near the yellow zone and support line we can again expect the continuation of the uptrend and our first target is 0.50 🚀
if
the price breaks the resistance there to the upside, we can see more gain 🚀🚀
and
the yellow zone on the chart is based on the Fibonacci levels ✔️
This is not financial advice, always do your own research.
Please, feel free to ask your question, write it in the comments below, and I will answer.
🐋
and
near the yellow zone and support line we can again expect the continuation of the uptrend and our first target is 0.50 🚀
if
the price breaks the resistance there to the upside, we can see more gain 🚀🚀
and
the yellow zone on the chart is based on the Fibonacci levels ✔️
This is not financial advice, always do your own research.
Please, feel free to ask your question, write it in the comments below, and I will answer.
🐋

Hi
If you enjoy my tips, please consider a tiny support🙏🙇🏼♂️
By trade safely on Bybit, world's #2 crypto exchange
Join via my link & get up to $30,000 gift👇
tinyurl.com/rejpptyd
Free signals:
t.me/madwhalechannel
thanks 🙏🙇🏼♂️
If you enjoy my tips, please consider a tiny support🙏🙇🏼♂️
By trade safely on Bybit, world's #2 crypto exchange
Join via my link & get up to $30,000 gift👇
tinyurl.com/rejpptyd
Free signals:
t.me/madwhalechannel
thanks 🙏🙇🏼♂️
פרסומים קשורים
כתב ויתור
המידע והפרסומים אינם מיועדים להיות, ואינם מהווים, ייעוץ או המלצה פיננסית, השקעתית, מסחרית או מכל סוג אחר המסופקת או מאושרת על ידי TradingView. קרא עוד ב־תנאי השימוש.