
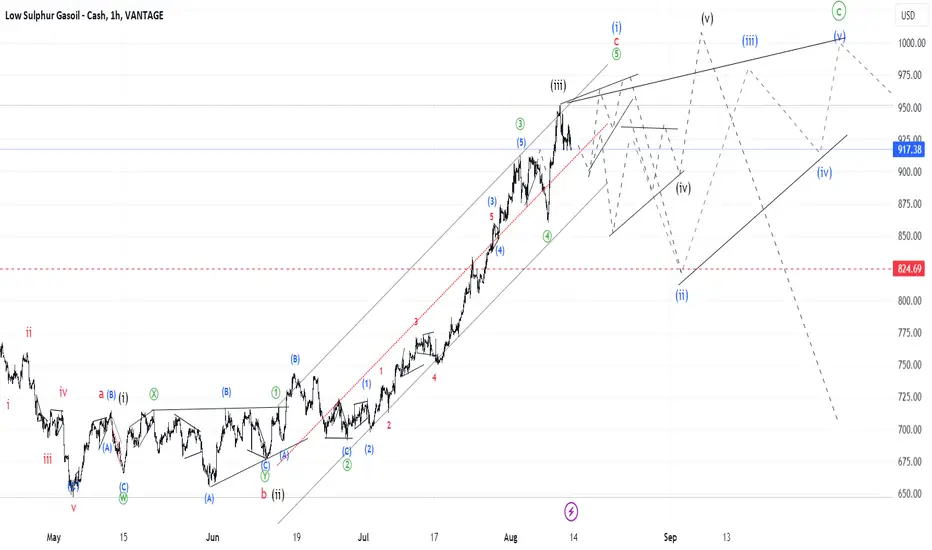
The Gasoil chart also has several alternatives to how it can shape the end of the uptrend. I indicated them on the chart below. Black labels mark the alternative scenario. Probability is not much different from each other. In summary, we have to prepare for a volatile environment which would be difficult to orientate until it is over and wave [c] of X is formed.

כתב ויתור
המידע והפרסומים אינם מיועדים להיות, ואינם מהווים, ייעוץ או המלצה פיננסית, השקעתית, מסחרית או מכל סוג אחר המסופקת או מאושרת על ידי TradingView. קרא עוד ב־תנאי השימוש.
כתב ויתור
המידע והפרסומים אינם מיועדים להיות, ואינם מהווים, ייעוץ או המלצה פיננסית, השקעתית, מסחרית או מכל סוג אחר המסופקת או מאושרת על ידי TradingView. קרא עוד ב־תנאי השימוש.