
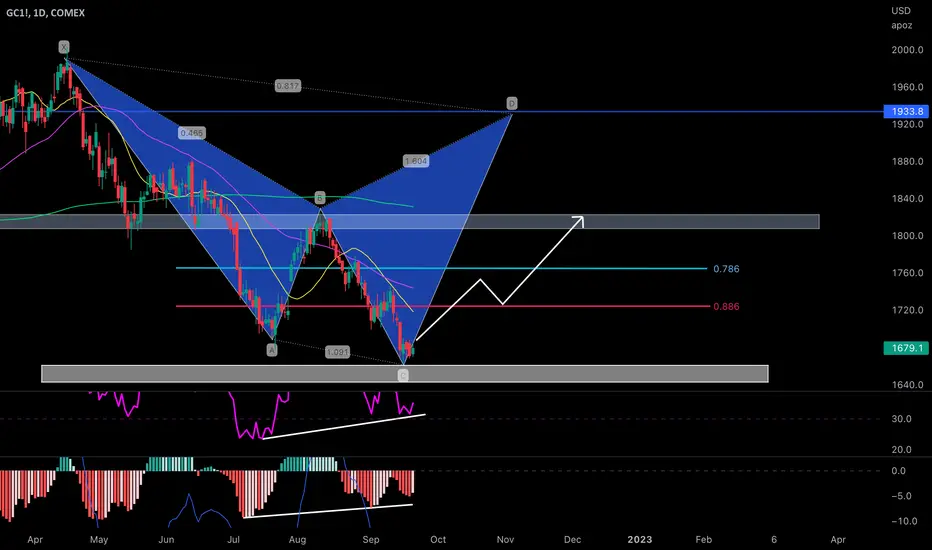
Hey y’all, i charted a possible bullish play that could potentially lead to some upside regarding GS1! Here we potentially have a alternate XABCD that’s below the typical pattern completion zone of the 786 and 886 fib retrace ratios. We are showing Class A Bullish Divergence on both oscillators IEW the RSI and MACD showing seller exhaustion and negative momentum winding down. We may see price action start to make a push upwards and go green in the next coming weeks… just my opinion on a possible outcome..

כתב ויתור
המידע והפרסומים אינם מיועדים להיות, ואינם מהווים, ייעוץ או המלצה פיננסית, השקעתית, מסחרית או מכל סוג אחר המסופקת או מאושרת על ידי TradingView. קרא עוד ב־תנאי השימוש.
כתב ויתור
המידע והפרסומים אינם מיועדים להיות, ואינם מהווים, ייעוץ או המלצה פיננסית, השקעתית, מסחרית או מכל סוג אחר המסופקת או מאושרת על ידי TradingView. קרא עוד ב־תנאי השימוש.