
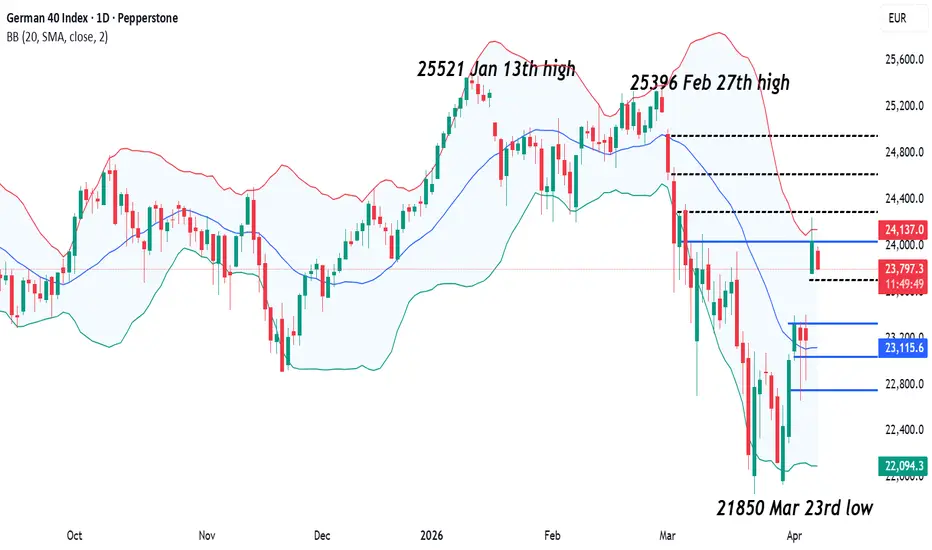
The strength of yesterday’s risk rally in the Germany 40, from a close on Tuesday at 23181 up to a high of 24240 yesterday, a spike of 4.5%, shows how much traders want to believe that the 14 day ceasefire is going to hold, oil will restart flowing through the Strait of Hormuz and on-going talks between the US-Iran will lead to further deescalation and an eventual end to the conflict.
However, there is still a lot to be resolved, and a high level of uncertainty remains. In the short term, claims from Iran that the ceasefire proposal has already been contravened have helped to put a cap on the rally, but the dip has been shallow (23910, 0730 BST) with traders initially willing to look beyond this and focus on the potential outcome of direct talks between the US-Iran which are currently scheduled to begin on Saturday morning in Islamabad, Pakistan. This situation could still change quickly.
Looking forward, general risk sentiment could also be impacted by the outcome of 2 key US inflation updates. The Fed’s preferred inflation gauge, the PCE Index, is due for release later today at 1330 BST, and then the CPI reading is due tomorrow at the same time. Any print above expectations could weigh on the recent risk rally, while an in-line or below expectation print could help to calm market concerns that the surge in global energy prices may force central banks, like the Fed and ECB, into interest rate hikes later in the year.
It is important to note, 48 hours is a long time to hold positions in this current volatile environment so there could be bigger moves on the horizon if traders feel the need to reposition or bank some profits on the recent Germany 40 rally into the Friday close.
Technical Update: Risk On Support Sees Retracement Resistance Challenged
While the Germany 40 Index had already entered a phase of price strength, it was the announcement of the 14-day ceasefire between the US and Iran that triggered further risk on sentiment, adding to the momentum of the latest recovery. Putting this move into numbers, the March 23rd low (21850) into Wednesday’s high (24240) saw the index rise around 11%.

Looking forward, much will clearly depend on future developments in the Middle East, including if the ceasefire holds. However, as the chart above shows, traders may now also be focused on a key potential resistance level at 24040, which is equal to the 61.8% Fibonacci retracement of the February 27th to March 23rd decline.
Potential Resistance Levels:
While the 24040 level was briefly broken within yesterday’s initial price strength, it held on a closing basis. For this reason, traders may now feel that 24040 needs to give way on a closing basis to open the potential of further positive momentum to extend the recovery move.
A close above 24040 could shift attention to 24357, which is the March 5th session high. A break above 24357, could open the way for moves toward 24676, which is the March 3rd upside extreme.
Possible Support Levels:
Of course, for now at least, the 24040 level is holding on a closing basis, which could suggest risks of a slowing in upside momentum. If this is the case, tests of downside supports may be seen, with the first level now perhaps marked by Wednesday’s low of 23751.
As the chart above highlights, closing breaks below 23751 could shift focus toward 23322, which is the 38.2% Fibonacci retracement of the latest advance. Closes below 23322, if seen, might then warn of further downside ahead, opening the way for declines to 23041, the deeper 50% retracement, even 22760, the 61.8% level.
The material provided here has not been prepared accordance with legal requirements designed to promote the independence of investment research and as such is considered to be a marketing communication. Whilst it is not subject to any prohibition on dealing ahead of the dissemination of investment research, we will not seek to take any advantage before providing it to our clients.
Pepperstone doesn’t represent that the material provided here is accurate, current or complete, and therefore shouldn’t be relied upon as such. The information, whether from a third party or not, isn’t to be considered as a recommendation; or an offer to buy or sell; or the solicitation of an offer to buy or sell any security, financial product or instrument; or to participate in any particular trading strategy. It does not take into account readers’ financial situation or investment objectives. We advise any readers of this content to seek their own advice. Without the approval of Pepperstone, reproduction or redistribution of this information isn’t permitted.
However, there is still a lot to be resolved, and a high level of uncertainty remains. In the short term, claims from Iran that the ceasefire proposal has already been contravened have helped to put a cap on the rally, but the dip has been shallow (23910, 0730 BST) with traders initially willing to look beyond this and focus on the potential outcome of direct talks between the US-Iran which are currently scheduled to begin on Saturday morning in Islamabad, Pakistan. This situation could still change quickly.
Looking forward, general risk sentiment could also be impacted by the outcome of 2 key US inflation updates. The Fed’s preferred inflation gauge, the PCE Index, is due for release later today at 1330 BST, and then the CPI reading is due tomorrow at the same time. Any print above expectations could weigh on the recent risk rally, while an in-line or below expectation print could help to calm market concerns that the surge in global energy prices may force central banks, like the Fed and ECB, into interest rate hikes later in the year.
It is important to note, 48 hours is a long time to hold positions in this current volatile environment so there could be bigger moves on the horizon if traders feel the need to reposition or bank some profits on the recent Germany 40 rally into the Friday close.
Technical Update: Risk On Support Sees Retracement Resistance Challenged
While the Germany 40 Index had already entered a phase of price strength, it was the announcement of the 14-day ceasefire between the US and Iran that triggered further risk on sentiment, adding to the momentum of the latest recovery. Putting this move into numbers, the March 23rd low (21850) into Wednesday’s high (24240) saw the index rise around 11%.
Looking forward, much will clearly depend on future developments in the Middle East, including if the ceasefire holds. However, as the chart above shows, traders may now also be focused on a key potential resistance level at 24040, which is equal to the 61.8% Fibonacci retracement of the February 27th to March 23rd decline.
Potential Resistance Levels:
While the 24040 level was briefly broken within yesterday’s initial price strength, it held on a closing basis. For this reason, traders may now feel that 24040 needs to give way on a closing basis to open the potential of further positive momentum to extend the recovery move.
A close above 24040 could shift attention to 24357, which is the March 5th session high. A break above 24357, could open the way for moves toward 24676, which is the March 3rd upside extreme.
Possible Support Levels:
Of course, for now at least, the 24040 level is holding on a closing basis, which could suggest risks of a slowing in upside momentum. If this is the case, tests of downside supports may be seen, with the first level now perhaps marked by Wednesday’s low of 23751.
As the chart above highlights, closing breaks below 23751 could shift focus toward 23322, which is the 38.2% Fibonacci retracement of the latest advance. Closes below 23322, if seen, might then warn of further downside ahead, opening the way for declines to 23041, the deeper 50% retracement, even 22760, the 61.8% level.
The material provided here has not been prepared accordance with legal requirements designed to promote the independence of investment research and as such is considered to be a marketing communication. Whilst it is not subject to any prohibition on dealing ahead of the dissemination of investment research, we will not seek to take any advantage before providing it to our clients.
Pepperstone doesn’t represent that the material provided here is accurate, current or complete, and therefore shouldn’t be relied upon as such. The information, whether from a third party or not, isn’t to be considered as a recommendation; or an offer to buy or sell; or the solicitation of an offer to buy or sell any security, financial product or instrument; or to participate in any particular trading strategy. It does not take into account readers’ financial situation or investment objectives. We advise any readers of this content to seek their own advice. Without the approval of Pepperstone, reproduction or redistribution of this information isn’t permitted.

Global risk Warning CFDs are complex instruments and come with a high risk of losing money rapidly due to leverage. Between 74-89% of retail investor accounts lose money when trading in CFDs. You should consider whether you understand how CFD
כתב ויתור
המידע והפרסומים אינם מיועדים להיות, ואינם מהווים, ייעוץ או המלצה פיננסית, השקעתית, מסחרית או מכל סוג אחר המסופקת או מאושרת על ידי TradingView. קרא עוד ב־תנאי השימוש.
Global risk Warning CFDs are complex instruments and come with a high risk of losing money rapidly due to leverage. Between 74-89% of retail investor accounts lose money when trading in CFDs. You should consider whether you understand how CFD
כתב ויתור
המידע והפרסומים אינם מיועדים להיות, ואינם מהווים, ייעוץ או המלצה פיננסית, השקעתית, מסחרית או מכל סוג אחר המסופקת או מאושרת על ידי TradingView. קרא עוד ב־תנאי השימוש.