
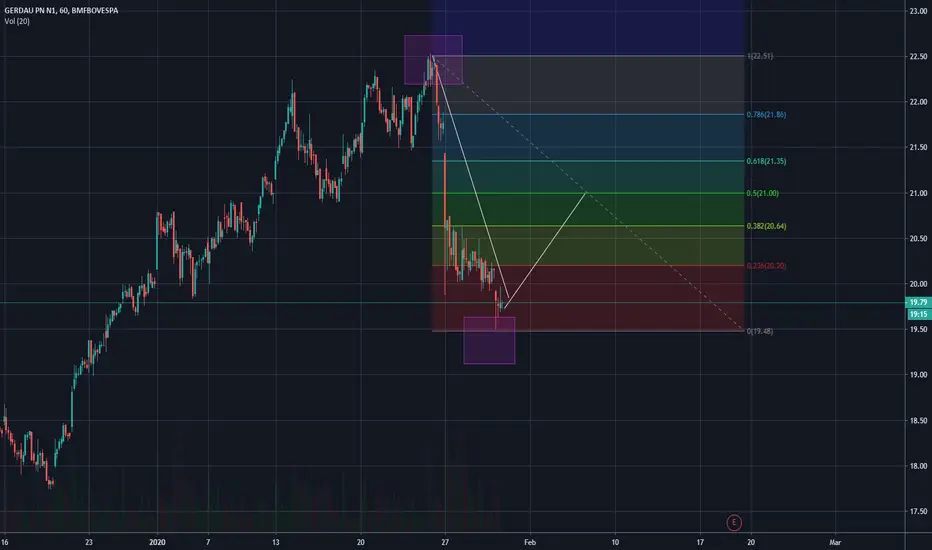
Rectangles represent the maximum and minimum values.
The white line represents the movement that I assume will happen.
The white line represents the movement that I assume will happen.
הערה
Therefore there was a rise up to 0.382, whete my exit point should have been. The line did not cross 0.5, so I will assume it will continue on a low trend.הערה
After the 0.382 retraction, the candles reached 0.5 fibonacci, where was my point of sale.I bought at 19.80 and sold at 20.95 making a 6% profit.

כתב ויתור
המידע והפרסומים אינם מיועדים להיות, ואינם מהווים, ייעוץ או המלצה פיננסית, השקעתית, מסחרית או מכל סוג אחר המסופקת או מאושרת על ידי TradingView. קרא עוד ב־תנאי השימוש.
כתב ויתור
המידע והפרסומים אינם מיועדים להיות, ואינם מהווים, ייעוץ או המלצה פיננסית, השקעתית, מסחרית או מכל סוג אחר המסופקת או מאושרת על ידי TradingView. קרא עוד ב־תנאי השימוש.