לונג
Multi-Timeframe Analysis: GM
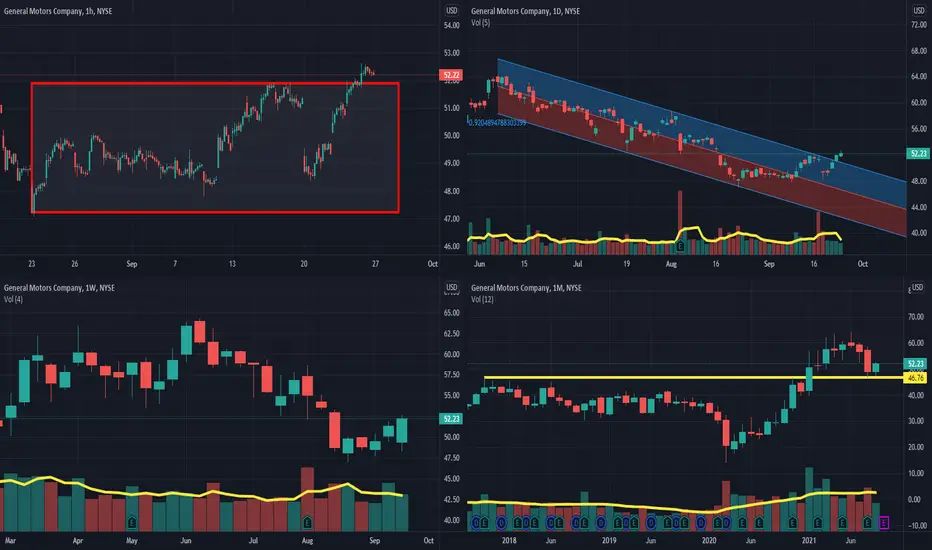
Multi-Timeframe Analysis:
Hourly Chart: getting out of consolidation pattern ( Bullish )
Daily Chart: getting out of downward regression channel + Three white soldiers pattern ( Bullish )
Trading volume in comparison to the last 5 days:
Weekly Chart: Bullish Outside bar
Trading volume in comparison to the last 4 weeks:+4%
Monthly Chart: Price action to support level.
Trading volume in comparison to the last 12 months:
Conclusion: I believe GM could take its previous top back, and even move further..!

Use the following link to access trading ideas: patreon.com/SniperTraderStocks?utm_medium=unknown&utm_source=join_link&utm_campaign=creatorshare_creator&utm_content=copyLink
כתב ויתור
המידע והפרסומים אינם מיועדים להיות, ואינם מהווים, ייעוץ או המלצה פיננסית, השקעתית, מסחרית או מכל סוג אחר המסופקת או מאושרת על ידי TradingView. קרא עוד ב־תנאי השימוש.
Use the following link to access trading ideas: patreon.com/SniperTraderStocks?utm_medium=unknown&utm_source=join_link&utm_campaign=creatorshare_creator&utm_content=copyLink
כתב ויתור
המידע והפרסומים אינם מיועדים להיות, ואינם מהווים, ייעוץ או המלצה פיננסית, השקעתית, מסחרית או מכל סוג אחר המסופקת או מאושרת על ידי TradingView. קרא עוד ב־תנאי השימוש.