
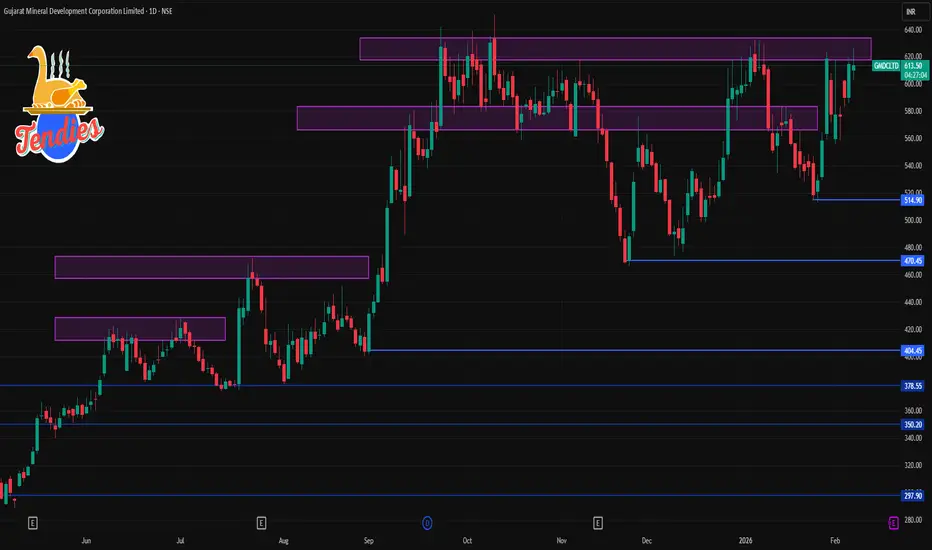
from NSE data:
📊 Daily Pivot & Key Levels (1D Timeframe)
📌 Daily Pivot Point (PP): ₹606.73 – This is the central bias level. Above this suggests short-term bullish control; below may signal weakness.
💥 Resistance Levels (Upside)
R1: ₹627.46 – first major resistance above the pivot
R2: ₹640.38 – medium-term barrier
R3: ₹661.11 – stronger supply zone / higher target
🛡️ Support Levels (Downside)
S1: ₹593.81 – immediate daily support
S2: ₹573.08 – deeper pullback level
S3: ₹560.16 – stronger lower support area
✔ How to use these levels (Daily view):
📈 Bullish conditions:
If price sustains above Pivot (₹606.73) → bias turns bullish
Stronger breakout confirmation if price closes above R1/R2 with volume
📉 Bearish conditions:
If price breaks below S1 (₹593.81) → watch for next supports (S2/S3)
Failure at resistance zones can lead to pullbacks
💡 Summary Daily Chart Levels (1D)
Level Price (Approx)
R3 661
R2 640
R1 627
Pivot 606
S1 594
S2 573
S3 560
(Levels rounded for clarity)

Contact Knowledgehub for a detailed consultation: Dm on WhatsApp: [wa.link/a2o0kz]-
Phone No: [+91 93102 26243]-
Email: [tradingviewknowledgehub@gmail.com]---
-- Let’s achieve success together!
Phone No: [+91 93102 26243]-
Email: [tradingviewknowledgehub@gmail.com]---
-- Let’s achieve success together!
פרסומים קשורים
כתב ויתור
המידע והפרסומים אינם מיועדים להיות, ואינם מהווים, ייעוץ או המלצה פיננסית, השקעתית, מסחרית או מכל סוג אחר המסופקת או מאושרת על ידי TradingView. קרא עוד ב־תנאי השימוש.