
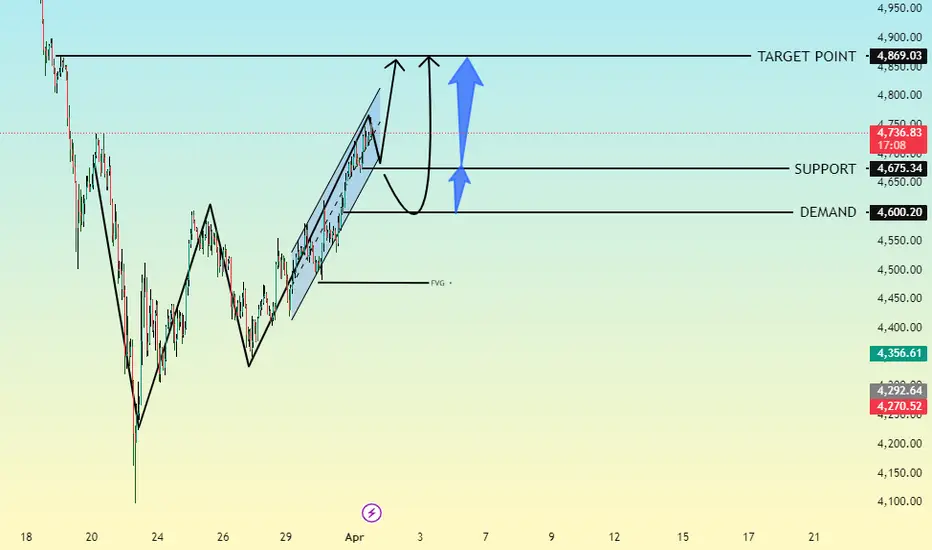
The chart shows a strong bullish recovery following a sharp sell-off, with price forming a clear impulsive structure to the upside. The sequence of higher highs and higher lows suggests buyers are currently in control.
After breaking previous structure, price is now approaching a major resistance zone near 4,869, which aligns with a prior supply area.
🔍 Key Levels
🎯 Target (Resistance): 4,869
Major supply zone
Likely area for liquidity grab or rejection
🟢 Support: 4,731
Short-term structure support
Holding above keeps bullish momentum intact
🟡 Demand Zone: 4,675 – 4,600
Strong buy zone
Potential retracement area before continuation
🧠 Trade Idea
The current price action suggests two probable scenarios:
1. Bullish Continuation (Preferred)
Price consolidates below resistance
Forms a minor pullback (possibly into support)
Then breaks above 4,869 targeting new highs
2. Rejection & Pullback
Price gets rejected at resistance
Retraces into the 4,731 support or deeper into the demand zone (4,675–4,600)
Looks for bullish confirmation before continuation
⚡ Price Behavior to Watch
Liquidity sweep above resistance (fake breakout)
Formation of higher low near support
Reaction inside the marked FVG (Fair Value Gap)
📝 Summary
The market remains bullish-biased as long as price holds above 4,731. A clean break and hold above 4,869 could trigger the next expansion leg upward, while rejection may offer a healthy pullback into demand before continuation.
After breaking previous structure, price is now approaching a major resistance zone near 4,869, which aligns with a prior supply area.
🔍 Key Levels
🎯 Target (Resistance): 4,869
Major supply zone
Likely area for liquidity grab or rejection
🟢 Support: 4,731
Short-term structure support
Holding above keeps bullish momentum intact
🟡 Demand Zone: 4,675 – 4,600
Strong buy zone
Potential retracement area before continuation
🧠 Trade Idea
The current price action suggests two probable scenarios:
1. Bullish Continuation (Preferred)
Price consolidates below resistance
Forms a minor pullback (possibly into support)
Then breaks above 4,869 targeting new highs
2. Rejection & Pullback
Price gets rejected at resistance
Retraces into the 4,731 support or deeper into the demand zone (4,675–4,600)
Looks for bullish confirmation before continuation
⚡ Price Behavior to Watch
Liquidity sweep above resistance (fake breakout)
Formation of higher low near support
Reaction inside the marked FVG (Fair Value Gap)
📝 Summary
The market remains bullish-biased as long as price holds above 4,731. A clean break and hold above 4,869 could trigger the next expansion leg upward, while rejection may offer a healthy pullback into demand before continuation.
העסקה בוטלה באופן ידני

Market update and everyday analysis with experience trader
more updates in my link
t.me/+JNoJE22gKaA0ZWI0
more updates in my link
t.me/+JNoJE22gKaA0ZWI0
פרסומים קשורים
כתב ויתור
המידע והפרסומים אינם מיועדים להיות, ואינם מהווים, ייעוץ או המלצה פיננסית, השקעתית, מסחרית או מכל סוג אחר המסופקת או מאושרת על ידי TradingView. קרא עוד ב־תנאי השימוש.
Market update and everyday analysis with experience trader
more updates in my link
t.me/+JNoJE22gKaA0ZWI0
more updates in my link
t.me/+JNoJE22gKaA0ZWI0
פרסומים קשורים
כתב ויתור
המידע והפרסומים אינם מיועדים להיות, ואינם מהווים, ייעוץ או המלצה פיננסית, השקעתית, מסחרית או מכל סוג אחר המסופקת או מאושרת על ידי TradingView. קרא עוד ב־תנאי השימוש.