
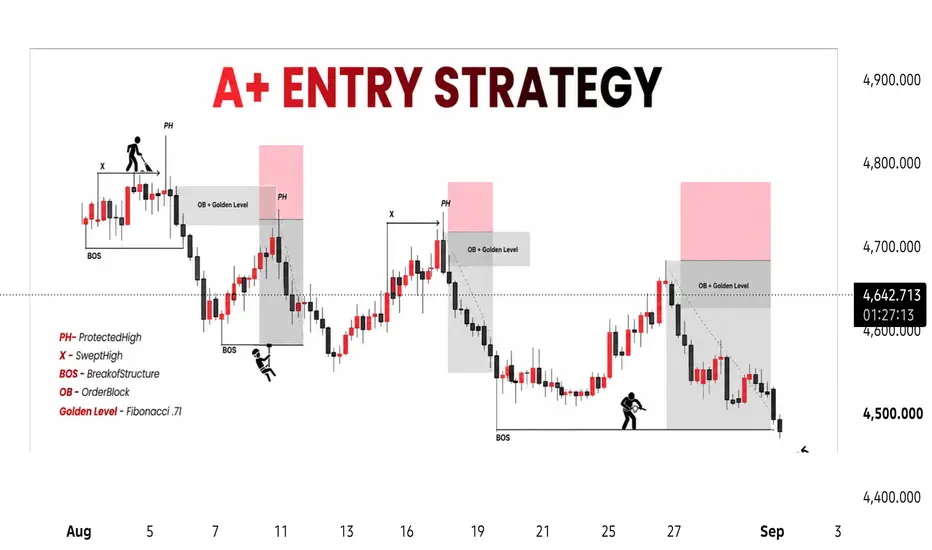
This 4H Gold analysis presents a structured price-action framework based on Market Structure, Liquidity Sweeps, Protected Highs, Break of Structure (BOS), Order Blocks (OB), and the Fibonacci 0.71 Golden Level.
The primary concept illustrated on the chart is the interaction between liquidity and institutional-style reaction zones. Price first develops a structural high, followed by a sweep of liquidity and subsequent displacement. When price returns toward the confluence of an Order Block and the 0.71 Fibonacci level, the area can be monitored for a potential reaction.
Technical Framework
• Protected High (PH): A significant structural high that remains protected until market structure changes.
• Sweep High (X): A liquidity event above a previous high before potential structural reversal.
• Break of Structure (BOS): Used to confirm a meaningful change or continuation in market structure.
• Order Block (OB): A predefined price area monitored for potential reaction based on the surrounding structure.
• Golden Level (0.71): Used as an additional Fibonacci confluence within the setup.
Market Interpretation
The chart demonstrates a recurring sequence:
Liquidity Sweep → Structural Reaction → BOS → Retracement → OB + 0.71 Confluence → Potential Continuation
The key objective is not to predict price with certainty, but to observe how price behaves around these predefined structural areas. A valid reaction should be assessed through price acceptance, rejection, displacement, and subsequent market-structure behavior.
Risk & Invalidation
The highlighted zones represent areas of technical interest, not guaranteed entry points. If price invalidates the underlying structure or establishes acceptance beyond the relevant zone, the original setup should be reconsidered.
This analysis is provided for educational and technical-analysis purposes only. It is not investment advice, a trade recommendation, or a guarantee of future market performance. Traders should conduct their own analysis and apply appropriate risk management.
The primary concept illustrated on the chart is the interaction between liquidity and institutional-style reaction zones. Price first develops a structural high, followed by a sweep of liquidity and subsequent displacement. When price returns toward the confluence of an Order Block and the 0.71 Fibonacci level, the area can be monitored for a potential reaction.
Technical Framework
• Protected High (PH): A significant structural high that remains protected until market structure changes.
• Sweep High (X): A liquidity event above a previous high before potential structural reversal.
• Break of Structure (BOS): Used to confirm a meaningful change or continuation in market structure.
• Order Block (OB): A predefined price area monitored for potential reaction based on the surrounding structure.
• Golden Level (0.71): Used as an additional Fibonacci confluence within the setup.
Market Interpretation
The chart demonstrates a recurring sequence:
Liquidity Sweep → Structural Reaction → BOS → Retracement → OB + 0.71 Confluence → Potential Continuation
The key objective is not to predict price with certainty, but to observe how price behaves around these predefined structural areas. A valid reaction should be assessed through price acceptance, rejection, displacement, and subsequent market-structure behavior.
Risk & Invalidation
The highlighted zones represent areas of technical interest, not guaranteed entry points. If price invalidates the underlying structure or establishes acceptance beyond the relevant zone, the original setup should be reconsidered.
This analysis is provided for educational and technical-analysis purposes only. It is not investment advice, a trade recommendation, or a guarantee of future market performance. Traders should conduct their own analysis and apply appropriate risk management.

כתב ויתור
המידע והפרסומים אינם מיועדים להיות, ואינם מהווים, ייעוץ או המלצה פיננסית, השקעתית, מסחרית או מכל סוג אחר המסופקת או מאושרת על ידי TradingView. קרא עוד ב־תנאי השימוש.
כתב ויתור
המידע והפרסומים אינם מיועדים להיות, ואינם מהווים, ייעוץ או המלצה פיננסית, השקעתית, מסחרית או מכל סוג אחר המסופקת או מאושרת על ידי TradingView. קרא עוד ב־תנאי השימוש.