
Market Bias: Bearish 🟥
Timeframe: 4H / HTF Narrative
Key Strategy: Liquidity & Mitigation
🧠 The Macro Narrative
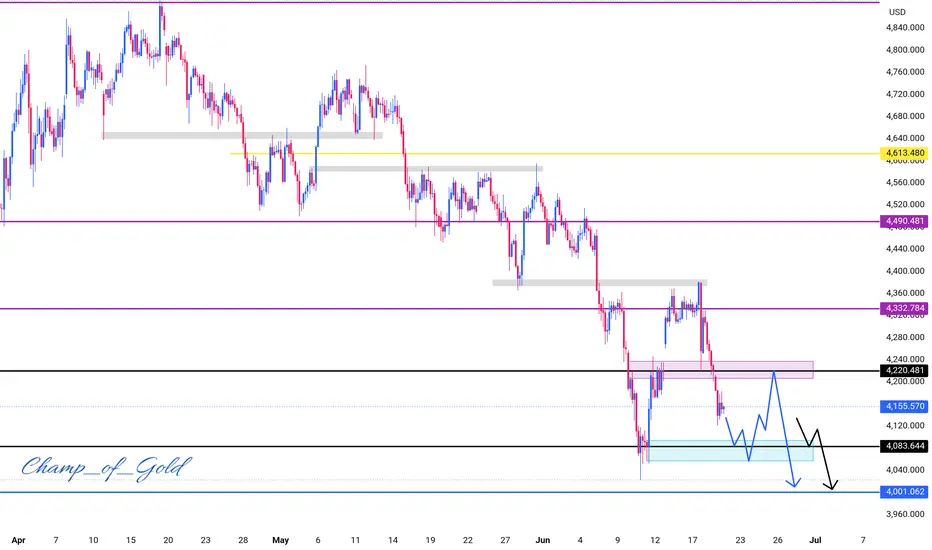
As mapped out in chart, the market is respecting a textbook bearish delivery mechanism. We have consistently printed lower highs and lower lows, leaving behind clean premium supply zones while aggressively targeting internal sell-side liquidity pools.
The structural invalidation for this entire bearish sequence remains well defined at the 4,513 key level. As long as price prints below this level, our structural directional bias is heavily skewed to the downside.
📐 Multi-Timeframe Execution Blueprint
We are tracking two high-probability structural paths for continuation down to our primary higher-timeframe target.
Path 1: The Premium Retracement (Blue Projection)
The Setup: Price sweeps local internal liquidity into the demand block at 4,083.644 (Cyan Zone), prompting an intra-week counter-trend pullback.
The Execution: We look for price to retrace into the premium breaker/supply zone at 4,220.481 (Purple Zone). If we see a Lower Timeframe (LTF) Market Structure Shift (MSS/CHoCH) inside this zone, we will position for a heavy swing short.
Target: 4,001.062 (HTF Draw on Liquidity).
Path 2: Direct Momentum Breakdown (Black Projection)
The Setup: Failure to sustain any minor demand at the 4,083.644 level.
The Execution: A clean body close below the cyan zone, followed by a minor lower timeframe retest of the broken structural level flipped into resistance.
Target: 4,001.062 (HTF Draw on Liquidity).
⚠️ Risk Management Parameters
Invalidation Level: A solid daily close above 4,220.481 shifts the immediate intra-week momentum to neutral/bullish.
Primary Draw on Liquidity: 4,001.062 (Major psychological level and HTF pool).
Do you see a deeper retracement into premium supply first, or do we flush directly from here? Let me know your thoughts in the comments below!
👇 Smash the Boost button if you find this mapping valuable, and follow for daily institutional breakdowns! 👇
Timeframe: 4H / HTF Narrative
Key Strategy: Liquidity & Mitigation
🧠 The Macro Narrative
As mapped out in chart, the market is respecting a textbook bearish delivery mechanism. We have consistently printed lower highs and lower lows, leaving behind clean premium supply zones while aggressively targeting internal sell-side liquidity pools.
The structural invalidation for this entire bearish sequence remains well defined at the 4,513 key level. As long as price prints below this level, our structural directional bias is heavily skewed to the downside.
📐 Multi-Timeframe Execution Blueprint
We are tracking two high-probability structural paths for continuation down to our primary higher-timeframe target.
Path 1: The Premium Retracement (Blue Projection)
The Setup: Price sweeps local internal liquidity into the demand block at 4,083.644 (Cyan Zone), prompting an intra-week counter-trend pullback.
The Execution: We look for price to retrace into the premium breaker/supply zone at 4,220.481 (Purple Zone). If we see a Lower Timeframe (LTF) Market Structure Shift (MSS/CHoCH) inside this zone, we will position for a heavy swing short.
Target: 4,001.062 (HTF Draw on Liquidity).
Path 2: Direct Momentum Breakdown (Black Projection)
The Setup: Failure to sustain any minor demand at the 4,083.644 level.
The Execution: A clean body close below the cyan zone, followed by a minor lower timeframe retest of the broken structural level flipped into resistance.
Target: 4,001.062 (HTF Draw on Liquidity).
⚠️ Risk Management Parameters
Invalidation Level: A solid daily close above 4,220.481 shifts the immediate intra-week momentum to neutral/bullish.
Primary Draw on Liquidity: 4,001.062 (Major psychological level and HTF pool).
Do you see a deeper retracement into premium supply first, or do we flush directly from here? Let me know your thoughts in the comments below!
👇 Smash the Boost button if you find this mapping valuable, and follow for daily institutional breakdowns! 👇
הערה
XAUUSD 4H: Institutional Order Flow & Bearish Expansion
Current Context:
The 4H timeframe shows a heavy institutional push downward, followed by a corrective internal retracement. The overall order flow is locked into a bearish delivery phase, making sells our highest probability setups.
The Entry Zone (Bearish Order Block):
The blue highlighted zone sits right below the 4,220.481 structural resistance. This is our primary Bearish Order Block.
We want to see the price tap into or reject from this blue zone to confirm that institutional supply is holding.
Projections & Targets:
Path 1 (Purple Projection): A clean continuation lower, taking out short-term internal lows to target the cyan support zone at 4,083.644.
Path 2 (Black Expansion): If the market gains heavy momentum after sweeping the cyan zone, look for a deeper expansion down to the major psychological and daily discount level at 4,001.062.
Execution Rule:
Do not chase the market if it drops early. Wait for the price to give us a clean lower-timeframe mitigation (such as an LTF CHoCH or Market Structure Shift) inside our defined Order Block zone before looking for entry triggers.

🏛️ XAUUSD | SMC & ICT
💎 VIP: 8-10 Daily Sniper Signals ➔
t.me/+wsTB6EFFcpgzZDQ0
📢 Free Community ➔ t.me/+I27cRTl31Zk0YzA0
💎 VIP: 8-10 Daily Sniper Signals ➔
t.me/+wsTB6EFFcpgzZDQ0
📢 Free Community ➔ t.me/+I27cRTl31Zk0YzA0
פרסומים קשורים
כתב ויתור
המידע והפרסומים אינם מיועדים להיות, ואינם מהווים, ייעוץ או המלצה פיננסית, השקעתית, מסחרית או מכל סוג אחר המסופקת או מאושרת על ידי TradingView. קרא עוד ב־תנאי השימוש.
🏛️ XAUUSD | SMC & ICT
💎 VIP: 8-10 Daily Sniper Signals ➔
t.me/+wsTB6EFFcpgzZDQ0
📢 Free Community ➔ t.me/+I27cRTl31Zk0YzA0
💎 VIP: 8-10 Daily Sniper Signals ➔
t.me/+wsTB6EFFcpgzZDQ0
📢 Free Community ➔ t.me/+I27cRTl31Zk0YzA0
פרסומים קשורים
כתב ויתור
המידע והפרסומים אינם מיועדים להיות, ואינם מהווים, ייעוץ או המלצה פיננסית, השקעתית, מסחרית או מכל סוג אחר המסופקת או מאושרת על ידי TradingView. קרא עוד ב־תנאי השימוש.