
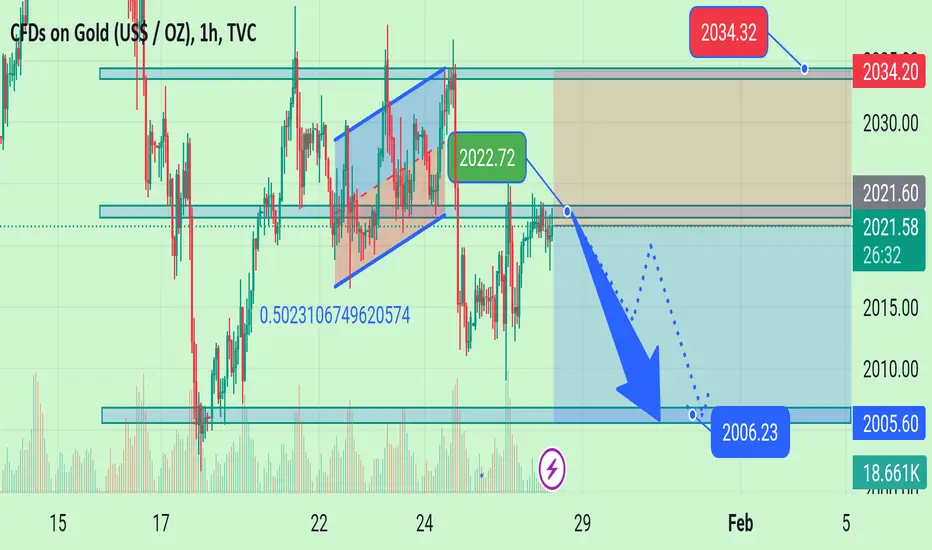
The daily chart for XAU/USD shows that the risk remains skewed to the downside. A bearish 20 Simple Moving Average (SMA) maintains its bearish slope above the current level, while the longer moving averages remain directionless, far below the current level. Technical indicators, in the meantime, hold directionless within negative levels.
According to near-term technical readings, XAU/USD is poised to extend its decline. The 4-hour chart shows the pair met intraday sellers around a mildly bearish 20 SMA while the longer ones grind lower above it. Technical indicators, in the meantime, accelerate lower within negative levels, supporting another leg south on a break below the $2,010 price zone.
Support levels: 2,010.00 2,001.60 1,988.60
Resistance levels: 2,021.80 2,033.10 2,040.30
Gold sell now 2022
Confirm Target 2005
According to near-term technical readings, XAU/USD is poised to extend its decline. The 4-hour chart shows the pair met intraday sellers around a mildly bearish 20 SMA while the longer ones grind lower above it. Technical indicators, in the meantime, accelerate lower within negative levels, supporting another leg south on a break below the $2,010 price zone.
Support levels: 2,010.00 2,001.60 1,988.60
Resistance levels: 2,021.80 2,033.10 2,040.30
Gold sell now 2022
Confirm Target 2005
הערה
20 pips running trade Profit 🔥🔥הערה
40 pips done boom boomהערה
Guy's support meהערה
60 pips runningהערה
Guy's join my telegram channelהערה
Enjoy free chart
כתב ויתור
המידע והפרסומים אינם מיועדים להיות, ואינם מהווים, ייעוץ או המלצה פיננסית, השקעתית, מסחרית או מכל סוג אחר המסופקת או מאושרת על ידי TradingView. קרא עוד ב־תנאי השימוש.
כתב ויתור
המידע והפרסומים אינם מיועדים להיות, ואינם מהווים, ייעוץ או המלצה פיננסית, השקעתית, מסחרית או מכל סוג אחר המסופקת או מאושרת על ידי TradingView. קרא עוד ב־תנאי השימוש.