
1️⃣ Market Structure & Liquidity Analysis
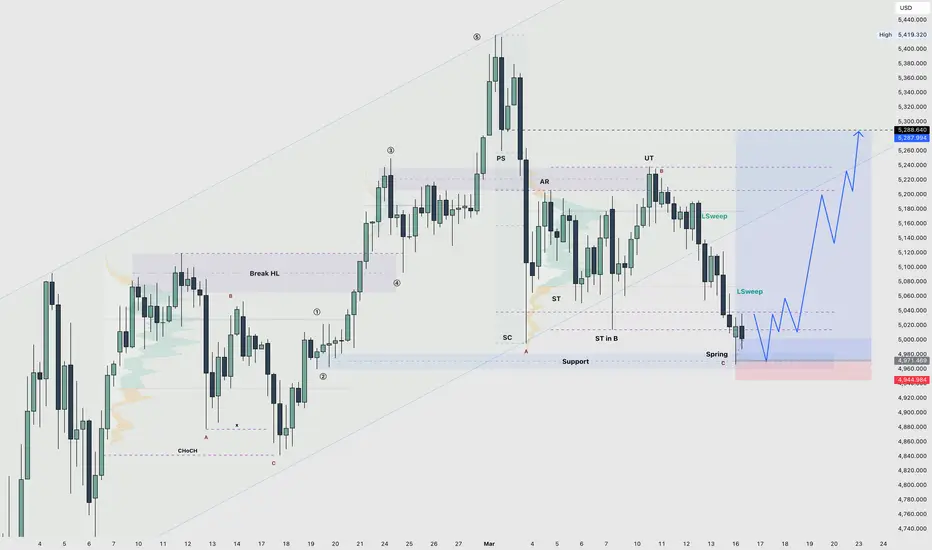
Gold remains inside a broader ascending channel while developing a Wyckoff accumulation range.
Structure shows: PS → AR → ST → UT (Phase B) → SC → developing Spring near 4,980–5,000.
The recent decline swept sell-side liquidity beneath the range lows and tapped into support. Downside momentum weakened immediately after the sweep, suggesting absorption rather than distribution.
Both sides of liquidity have now been engineered:
• UT cleared buy-side liquidity
• Spring cleared sell-side liquidity
Higher-timeframe structure remains intact.
2️⃣ Structural Outlook & Bias
If the Spring zone (4,960–5,000) holds:
• Phase D confirmation becomes likely
• 5,200 acts as reclaim trigger
• Expansion towards 5,300–5,380 becomes the natural liquidity objective
If the Spring fails:
• Deeper range rotation may occur before continuation
Current bias: Bullish continuation, conditional on Spring defence.
Compression suggests preparation for expansion, not breakdown.
Gold remains inside a broader ascending channel while developing a Wyckoff accumulation range.
Structure shows: PS → AR → ST → UT (Phase B) → SC → developing Spring near 4,980–5,000.
The recent decline swept sell-side liquidity beneath the range lows and tapped into support. Downside momentum weakened immediately after the sweep, suggesting absorption rather than distribution.
Both sides of liquidity have now been engineered:
• UT cleared buy-side liquidity
• Spring cleared sell-side liquidity
Higher-timeframe structure remains intact.
2️⃣ Structural Outlook & Bias
If the Spring zone (4,960–5,000) holds:
• Phase D confirmation becomes likely
• 5,200 acts as reclaim trigger
• Expansion towards 5,300–5,380 becomes the natural liquidity objective
If the Spring fails:
• Deeper range rotation may occur before continuation
Current bias: Bullish continuation, conditional on Spring defence.
Compression suggests preparation for expansion, not breakdown.

𝗠𝗮𝗿𝗸𝗲𝘁 𝗯𝗲𝗵𝗮𝘃𝗶𝗼𝘂𝗿 | 𝗗𝗲𝗰𝗶𝘀𝗶𝗼𝗻-𝗺𝗮𝗸𝗶𝗻𝗴
Trader | Investor | Analysis
𝗥𝗲𝗮𝗹-𝘁𝗶𝗺𝗲 𝗰𝗼𝗻𝘁𝗲𝘅𝘁 → Telegram
Telegram: t.me/sphyntrading
Trader | Investor | Analysis
𝗥𝗲𝗮𝗹-𝘁𝗶𝗺𝗲 𝗰𝗼𝗻𝘁𝗲𝘅𝘁 → Telegram
Telegram: t.me/sphyntrading
כתב ויתור
המידע והפרסומים אינם מיועדים להיות, ואינם מהווים, ייעוץ או המלצה פיננסית, השקעתית, מסחרית או מכל סוג אחר המסופקת או מאושרת על ידי TradingView. קרא עוד ב־תנאי השימוש.
𝗠𝗮𝗿𝗸𝗲𝘁 𝗯𝗲𝗵𝗮𝘃𝗶𝗼𝘂𝗿 | 𝗗𝗲𝗰𝗶𝘀𝗶𝗼𝗻-𝗺𝗮𝗸𝗶𝗻𝗴
Trader | Investor | Analysis
𝗥𝗲𝗮𝗹-𝘁𝗶𝗺𝗲 𝗰𝗼𝗻𝘁𝗲𝘅𝘁 → Telegram
Telegram: t.me/sphyntrading
Trader | Investor | Analysis
𝗥𝗲𝗮𝗹-𝘁𝗶𝗺𝗲 𝗰𝗼𝗻𝘁𝗲𝘅𝘁 → Telegram
Telegram: t.me/sphyntrading
כתב ויתור
המידע והפרסומים אינם מיועדים להיות, ואינם מהווים, ייעוץ או המלצה פיננסית, השקעתית, מסחרית או מכל סוג אחר המסופקת או מאושרת על ידי TradingView. קרא עוד ב־תנאי השימוש.