
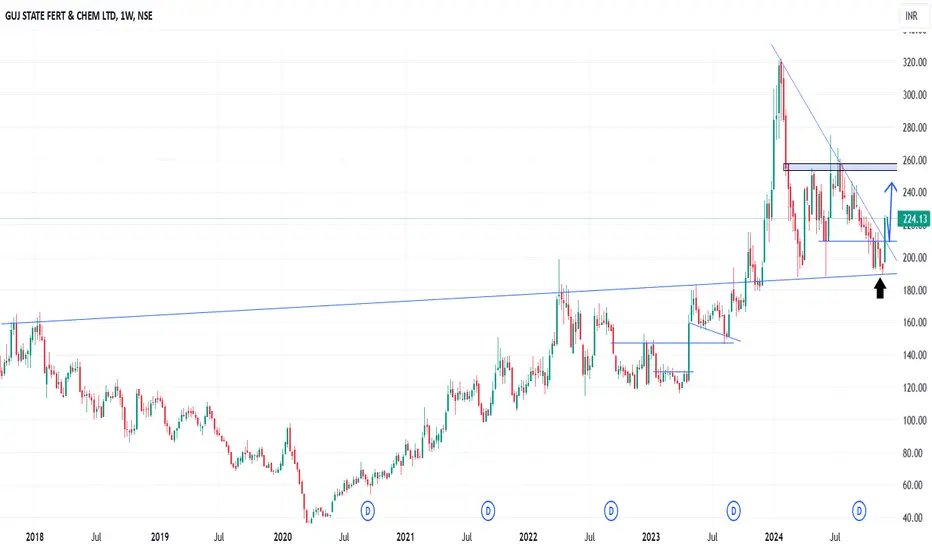
In the Weekly Chart of GSFC ,
we can see that, after Big Cup & handle breakout, it retested and formed a Hammer candle.
Also, it has shown an up move with W breakout.
et it retests it and then Enter with SL and Targets.
Expected momentum is shown in chart.
we can see that, after Big Cup & handle breakout, it retested and formed a Hammer candle.
Also, it has shown an up move with W breakout.
et it retests it and then Enter with SL and Targets.
Expected momentum is shown in chart.

כתב ויתור
המידע והפרסומים אינם מיועדים להיות, ואינם מהווים, ייעוץ או המלצה פיננסית, השקעתית, מסחרית או מכל סוג אחר המסופקת או מאושרת על ידי TradingView. קרא עוד ב־תנאי השימוש.
כתב ויתור
המידע והפרסומים אינם מיועדים להיות, ואינם מהווים, ייעוץ או המלצה פיננסית, השקעתית, מסחרית או מכל סוג אחר המסופקת או מאושרת על ידי TradingView. קרא עוד ב־תנאי השימוש.