GVT 3/5
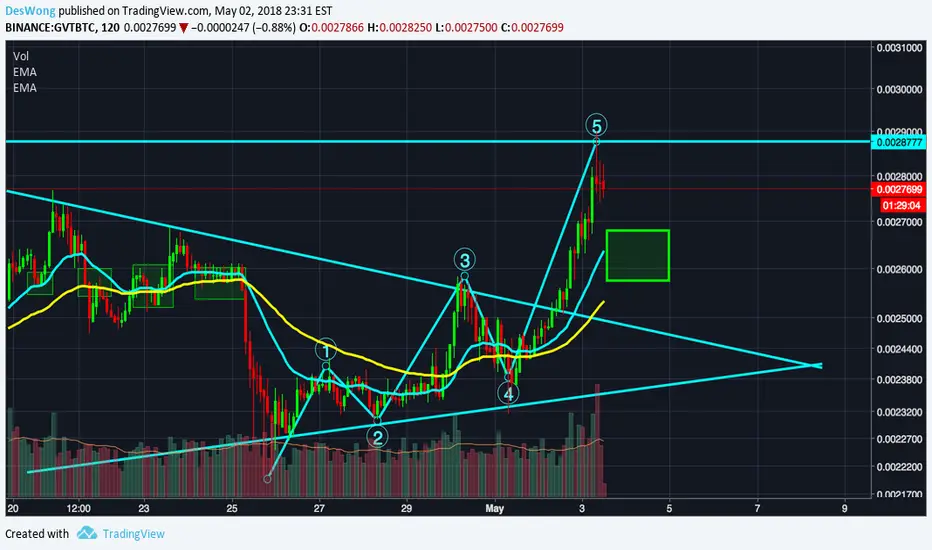
On a 2 hour chart, a hanging man has formed with its wick hit on the resistance and a doji with high volume have formed, RSI is overbought as well, it indicates the bull has lost its steam. So, a temporary correction is due.
The previous 25700 strong resistance has now become a strong support, expect a bounce from there.
Again, it is not financial advice and this chart is mainly for people who day-trade or swing-trade. For long term investor, you can ignore this short term price fluctuation.
The previous 25700 strong resistance has now become a strong support, expect a bounce from there.
Again, it is not financial advice and this chart is mainly for people who day-trade or swing-trade. For long term investor, you can ignore this short term price fluctuation.

כתב ויתור
המידע והפרסומים אינם מיועדים להיות, ואינם מהווים, ייעוץ או המלצה פיננסית, השקעתית, מסחרית או מכל סוג אחר המסופקת או מאושרת על ידי TradingView. קרא עוד ב־תנאי השימוש.
כתב ויתור
המידע והפרסומים אינם מיועדים להיות, ואינם מהווים, ייעוץ או המלצה פיננסית, השקעתית, מסחרית או מכל סוג אחר המסופקת או מאושרת על ידי TradingView. קרא עוד ב־תנאי השימוש.