שורט
GVTBTC Weekly Chart
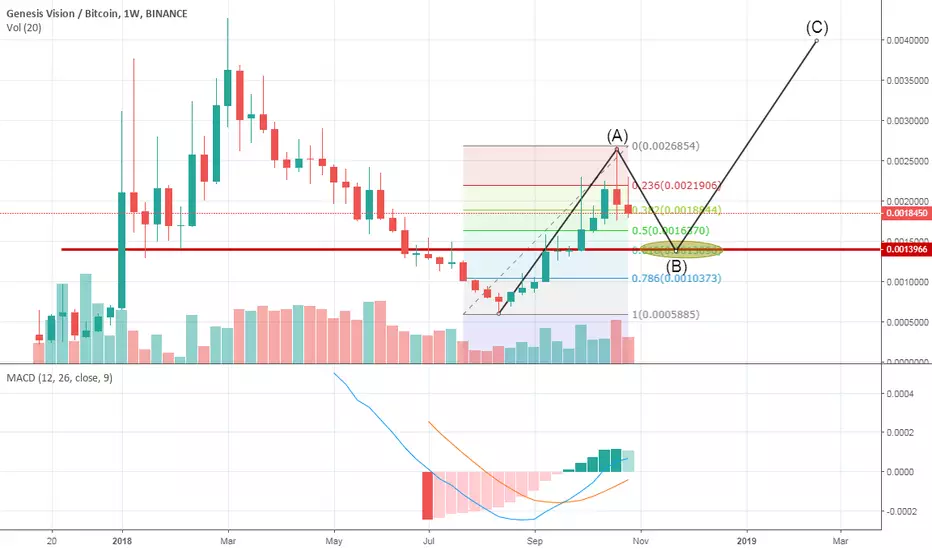
GVTBTC weekly chart looking bearish. it is looking in an ABC pattaern and now drawing B wave. it can go to fib 0.618 line and it is also strong support line (about 13900). fib 0.618 level (13900) can be a good buy point. Not a trade advice.
הערה
Possible inverse Head and Shoulders Pattern

כתב ויתור
המידע והפרסומים אינם מיועדים להיות, ואינם מהווים, ייעוץ או המלצה פיננסית, השקעתית, מסחרית או מכל סוג אחר המסופקת או מאושרת על ידי TradingView. קרא עוד ב־תנאי השימוש.
כתב ויתור
המידע והפרסומים אינם מיועדים להיות, ואינם מהווים, ייעוץ או המלצה פיננסית, השקעתית, מסחרית או מכל סוג אחר המסופקת או מאושרת על ידי TradingView. קרא עוד ב־תנאי השימוש.