
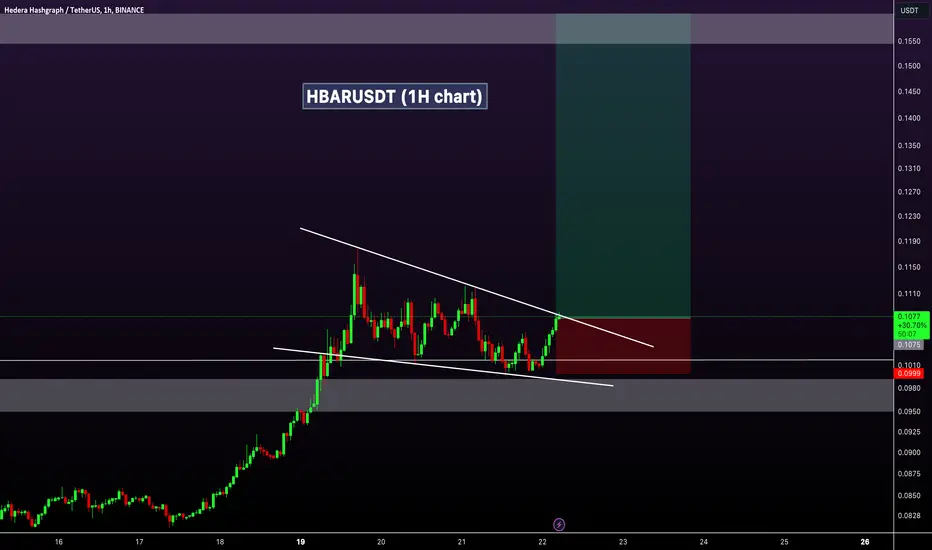
HBARUSDT Technical analysis update
HBAR formed a bullish flag pattern on the 1-hour chart. If the price exceeds the resistance line of the flag pattern, it could indicate potential upward movement in HBAR
Buy zone : Below $0.108
Stop loss : $0.100
Regards
Hexa
HBAR formed a bullish flag pattern on the 1-hour chart. If the price exceeds the resistance line of the flag pattern, it could indicate potential upward movement in HBAR
Buy zone : Below $0.108
Stop loss : $0.100
Regards
Hexa

🚀Telegram : t.me/hexatrades
🌐Website: hexatrades.io/
🗣️Twitter(X): twitter.com/HexaTrades
🌐Website: hexatrades.io/
🗣️Twitter(X): twitter.com/HexaTrades
פרסומים קשורים
כתב ויתור
המידע והפרסומים אינם מיועדים להיות, ואינם מהווים, ייעוץ או המלצה פיננסית, השקעתית, מסחרית או מכל סוג אחר המסופקת או מאושרת על ידי TradingView. קרא עוד ב־תנאי השימוש.
🚀Telegram : t.me/hexatrades
🌐Website: hexatrades.io/
🗣️Twitter(X): twitter.com/HexaTrades
🌐Website: hexatrades.io/
🗣️Twitter(X): twitter.com/HexaTrades
פרסומים קשורים
כתב ויתור
המידע והפרסומים אינם מיועדים להיות, ואינם מהווים, ייעוץ או המלצה פיננסית, השקעתית, מסחרית או מכל סוג אחר המסופקת או מאושרת על ידי TradingView. קרא עוד ב־תנאי השימוש.