
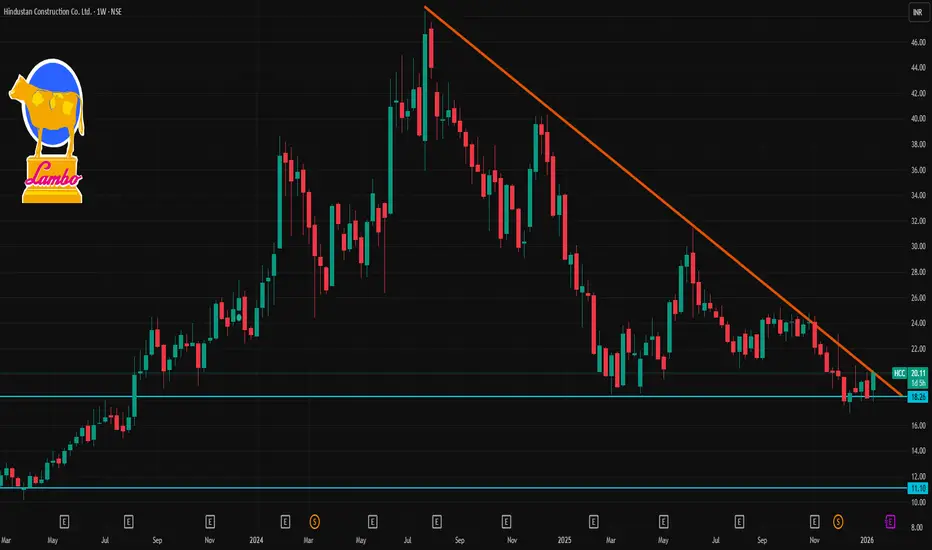
📍 Live Price Snapshot
Approx current price: ~₹18.7–₹19.0 (latest live levels)
📊 1‑Week Technical Levels (Pivot Based)
These levels are useful for short‑term trades this week:
🔹 Weekly Pivot & Resistance
Pivot Point: ₹18.79 (base zone)
R1 (First Resistance): ~₹19.09
R2: ~₹19.56
R3: ~₹19.86
👉 Bullish view: Sustained trade above R1 ~₹19.1–₹19.3 may signal short‑term upside continuation towards R2/R3.
🔻 Weekly Support Levels
S1: ~₹18.32
S2: ~₹18.02
S3: ~₹17.55
👉 Bearish view: A break below S2 ~₹18.0 can open risk toward S3 ~₹17.5.
📌 Short‑Term Trend Indicators
RSI (~neutral): ~46–56 — showing neither strong buy nor oversold pressure currently.
Moving Averages: Price is near short‑term moving averages, but all major mid‑term EMAs/SMAs are above price indicating a bearish bias in broader trend.
Summary of Technical Bias:
Bullish above pivot/R1 (~₹18.8–19.1): Could test R2 ~₹19.5 and R3 ~₹19.8+.
Neutral range: Between ₹18.3–₹19.1.
Bearish below S1/S2 (~₹18.3/₹18.0): Potential move down toward ₹17.5 support.
🧠 Weekly Outlook (Quick Interpret)
✔ Immediate resistance range: ₹19.1–₹19.8
✔ Immediate support range: ₹18.0–₹18.5
✔ Trend context: Short‑term consolidation with a slight bearish edge on broader SMAs; buy setup improves only on clear weekly strength above the pivot/resistance zone.

Contact Knowledgehub for a detailed consultation: Dm on WhatsApp: [wa.link/a2o0kz]-
Phone No: [+91 93102 26243]-
Email: [tradingviewknowledgehub@gmail.com]---
-- Let’s achieve success together!
Phone No: [+91 93102 26243]-
Email: [tradingviewknowledgehub@gmail.com]---
-- Let’s achieve success together!
פרסומים קשורים
כתב ויתור
המידע והפרסומים אינם מיועדים להיות, ואינם מהווים, ייעוץ או המלצה פיננסית, השקעתית, מסחרית או מכל סוג אחר המסופקת או מאושרת על ידי TradingView. קרא עוד ב־תנאי השימוש.