
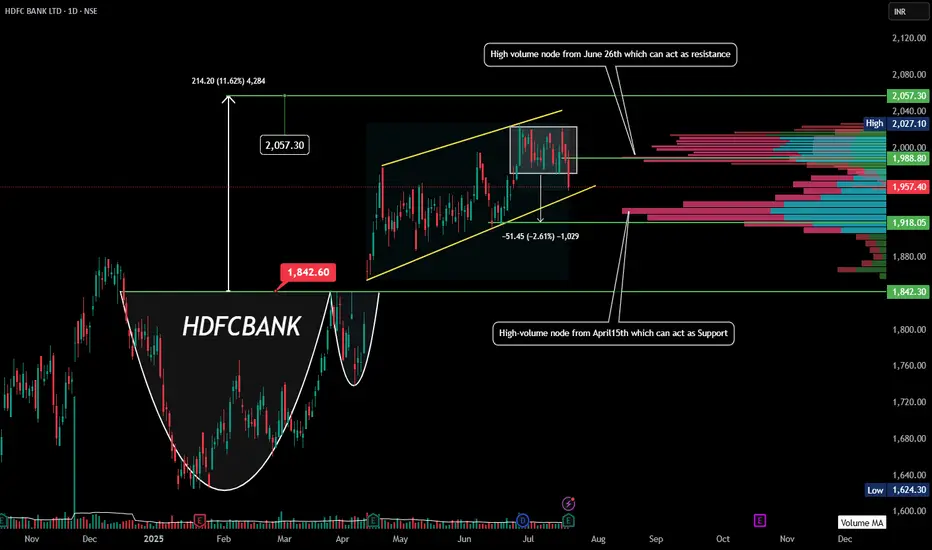
🔍 Quick Summary: What’s Priced In?
Despite a solid PAT beat (₹18,160 Cr, +12% YoY), NII missed expectations (only +5% YoY) and margins fell. The profit beat was largely driven by non-core gains (₹9,130 Cr stake sale in HDB Financial). This signals:
Core operations slightly underwhelming
Market may not reward the PAT beat aggressively
Bonus + Dividend is already priced in (price rallied earlier)
📉 Technical & Derivatives Outlook:
🧱 Price Action:
Cup & handle breakout recently happened ✔️
Price is stuck in a channel (as seen on the chart)
Consolidation breakdown on friday -target 1918.75
Facing strong resistance around ₹2000–2040 (High Volume Nodes + OI buildup)
Immediate support: ₹1918–1840 (Volume cluster + previous breakout retest)
🔍 OI Data (as of July 18):
PCR: 0.6 → Bearish bias
Highest Call OI: 2000–2040 CE → Acts as resistance ceiling
Strong Put OI only around 1900–1920 → Weak support zone forming
🔮 Expected Price Action Next Week:
🔻 Bearish to Sideways Bias:
Given weak core NII and resistance zone near ₹2000, stock might consolidate or correct slightly.
If ₹1918 breaks, can test ₹1840 again.
Only a breakout above ₹ 1988 and ₹2040 with volume will revive bullish momentum.
🛡️ Key Levels to Watch:
Direction Key Level Action
Resistance ₹1988–2027 Selling pressure(OI + HVN)
Support ₹1918 Breakdown -₹1840
Strong Sup ₹1840 High volume node + previous breakout
🎯 Conclusion (1-week view):
📉 Slightly bearish / sideways expected
📌 Likely range: ₹1918 – ₹2000. Cmp- 1957
🎯 Bulls need a close above ₹2040 for further upside
Despite a solid PAT beat (₹18,160 Cr, +12% YoY), NII missed expectations (only +5% YoY) and margins fell. The profit beat was largely driven by non-core gains (₹9,130 Cr stake sale in HDB Financial). This signals:
Core operations slightly underwhelming
Market may not reward the PAT beat aggressively
Bonus + Dividend is already priced in (price rallied earlier)
📉 Technical & Derivatives Outlook:
🧱 Price Action:
Cup & handle breakout recently happened ✔️
Price is stuck in a channel (as seen on the chart)
Consolidation breakdown on friday -target 1918.75
Facing strong resistance around ₹2000–2040 (High Volume Nodes + OI buildup)
Immediate support: ₹1918–1840 (Volume cluster + previous breakout retest)
🔍 OI Data (as of July 18):
PCR: 0.6 → Bearish bias
Highest Call OI: 2000–2040 CE → Acts as resistance ceiling
Strong Put OI only around 1900–1920 → Weak support zone forming
🔮 Expected Price Action Next Week:
🔻 Bearish to Sideways Bias:
Given weak core NII and resistance zone near ₹2000, stock might consolidate or correct slightly.
If ₹1918 breaks, can test ₹1840 again.
Only a breakout above ₹ 1988 and ₹2040 with volume will revive bullish momentum.
🛡️ Key Levels to Watch:
Direction Key Level Action
Resistance ₹1988–2027 Selling pressure(OI + HVN)
Support ₹1918 Breakdown -₹1840
Strong Sup ₹1840 High volume node + previous breakout
🎯 Conclusion (1-week view):
📉 Slightly bearish / sideways expected
📌 Likely range: ₹1918 – ₹2000. Cmp- 1957
🎯 Bulls need a close above ₹2040 for further upside

כתב ויתור
המידע והפרסומים אינם מיועדים להיות, ואינם מהווים, ייעוץ או המלצה פיננסית, השקעתית, מסחרית או מכל סוג אחר המסופקת או מאושרת על ידי TradingView. קרא עוד ב־תנאי השימוש.
כתב ויתור
המידע והפרסומים אינם מיועדים להיות, ואינם מהווים, ייעוץ או המלצה פיננסית, השקעתית, מסחרית או מכל סוג אחר המסופקת או מאושרת על ידי TradingView. קרא עוד ב־תנאי השימוש.