
01-12
Daily chart of HDFCBANK1!
LTP: 1638.25
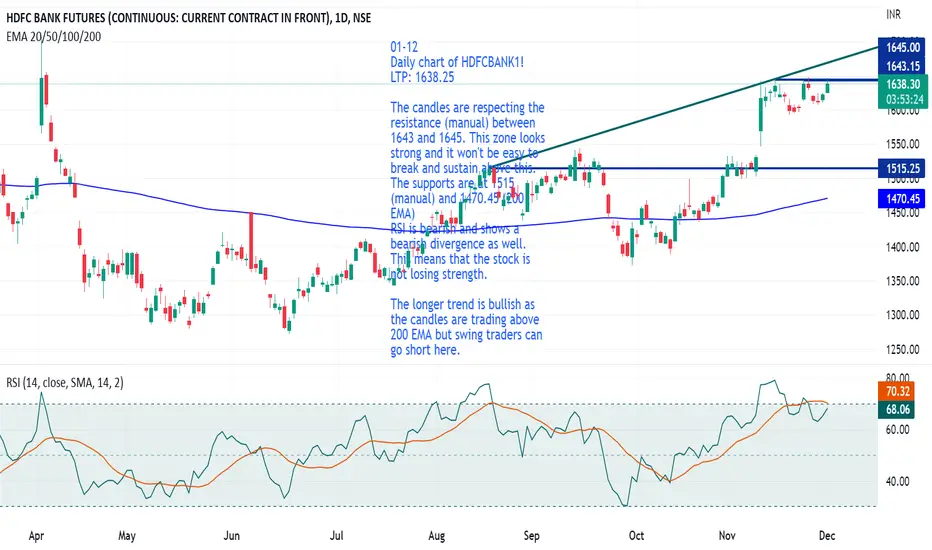
The candles are respecting the resistance (manual) between 1643 and 1645. This zone looks strong and it won't be easy to break and sustain above this.
The supports are at 1515 (manual) and 1470.45 (200 EMA)
RSI is bearish and shows a bearish divergence as well. This means that the stock is not losing strength.
The longer trend is bullish as the candles are trading above 200 EMA but swing traders can go short here.

כתב ויתור
המידע והפרסומים אינם מיועדים להיות, ואינם מהווים, ייעוץ או המלצה פיננסית, השקעתית, מסחרית או מכל סוג אחר המסופקת או מאושרת על ידי TradingView. קרא עוד ב־תנאי השימוש.
כתב ויתור
המידע והפרסומים אינם מיועדים להיות, ואינם מהווים, ייעוץ או המלצה פיננסית, השקעתית, מסחרית או מכל סוג אחר המסופקת או מאושרת על ידי TradingView. קרא עוד ב־תנאי השימוש.