
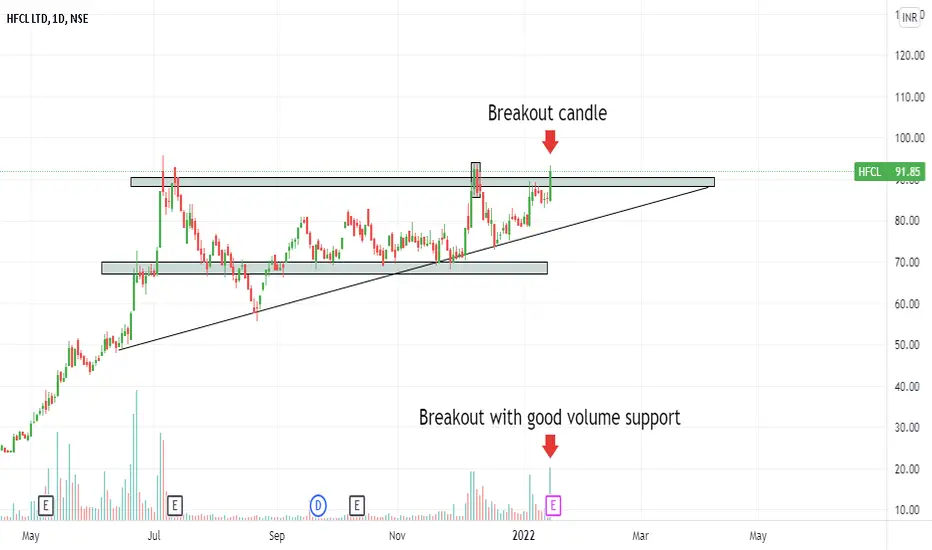
Here's the chart analysis of HFCL .
HFCL in an uptrend and it formed a Triangle Pattern breakout with a Good Volume support . In terms of the the pattern touches the Resistance zone and now gives a Breakout . after a breakout wait for a next move and price moves towards a upside .
HFCL in an uptrend and it formed a Triangle Pattern breakout with a Good Volume support . In terms of the the pattern touches the Resistance zone and now gives a Breakout . after a breakout wait for a next move and price moves towards a upside .

כתב ויתור
המידע והפרסומים אינם מיועדים להיות, ואינם מהווים, ייעוץ או המלצה פיננסית, השקעתית, מסחרית או מכל סוג אחר המסופקת או מאושרת על ידי TradingView. קרא עוד ב־תנאי השימוש.
כתב ויתור
המידע והפרסומים אינם מיועדים להיות, ואינם מהווים, ייעוץ או המלצה פיננסית, השקעתית, מסחרית או מכל סוג אחר המסופקת או מאושרת על ידי TradingView. קרא עוד ב־תנאי השימוש.